Fig. 5
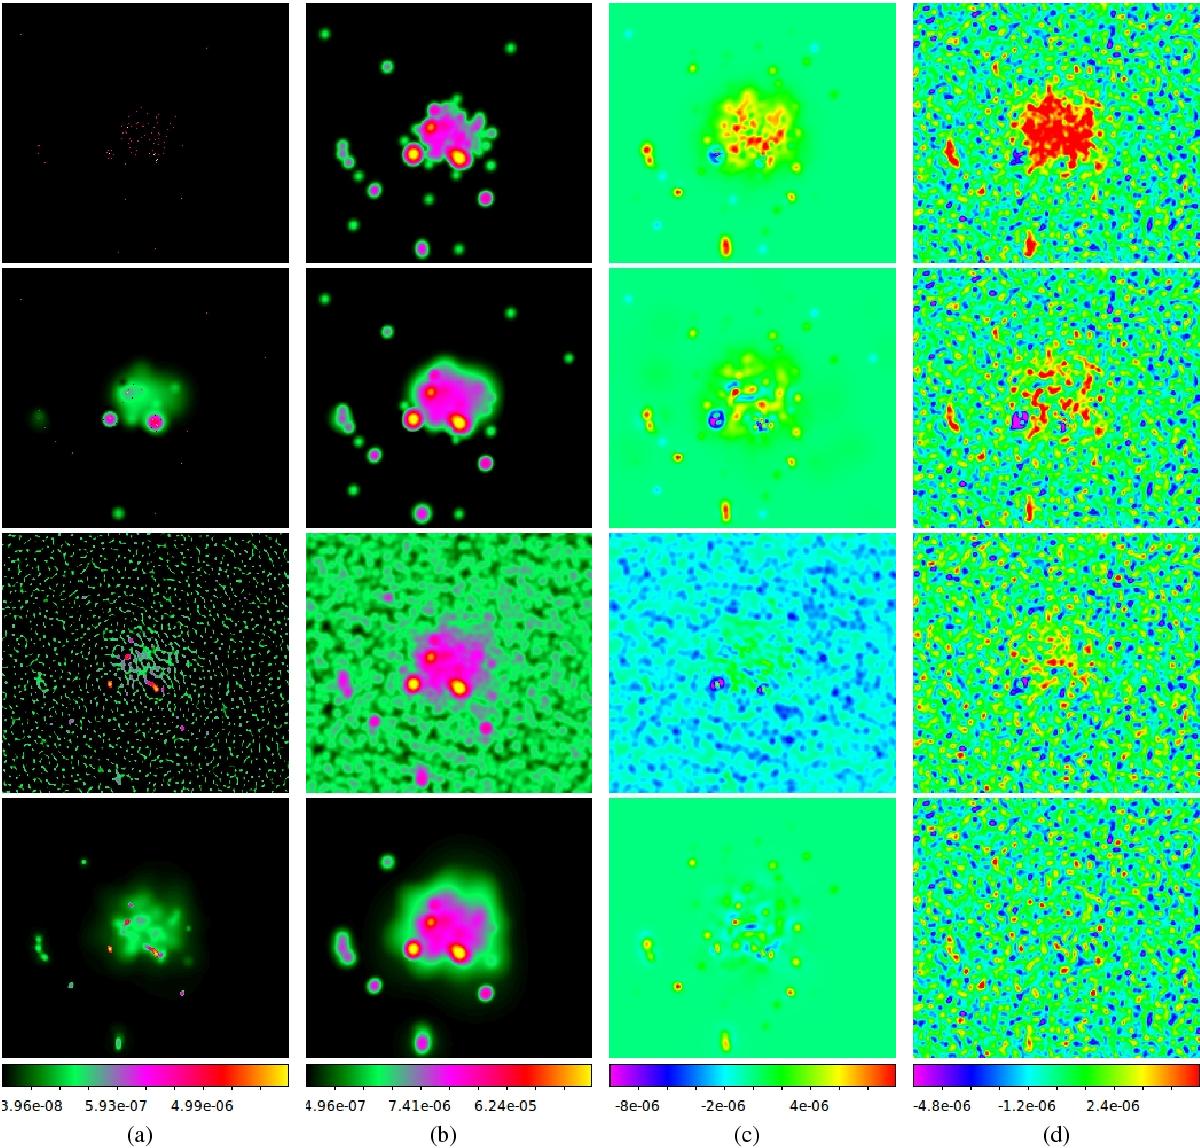
Reconstructed images of the galaxy cluster observations simulated with MeerKAT. The results are shown from top to bottom for Högbom CLEAN, Multi-scale CLEAN, IUWT-based CS and MORESANE. From left to right, model images a), beamed images b), error images of the beamed models with respect to the beamed true sky c) and residual images d).
Current usage metrics show cumulative count of Article Views (full-text article views including HTML views, PDF and ePub downloads, according to the available data) and Abstracts Views on Vision4Press platform.
Data correspond to usage on the plateform after 2015. The current usage metrics is available 48-96 hours after online publication and is updated daily on week days.
Initial download of the metrics may take a while.