Free Access
Fig. B.1
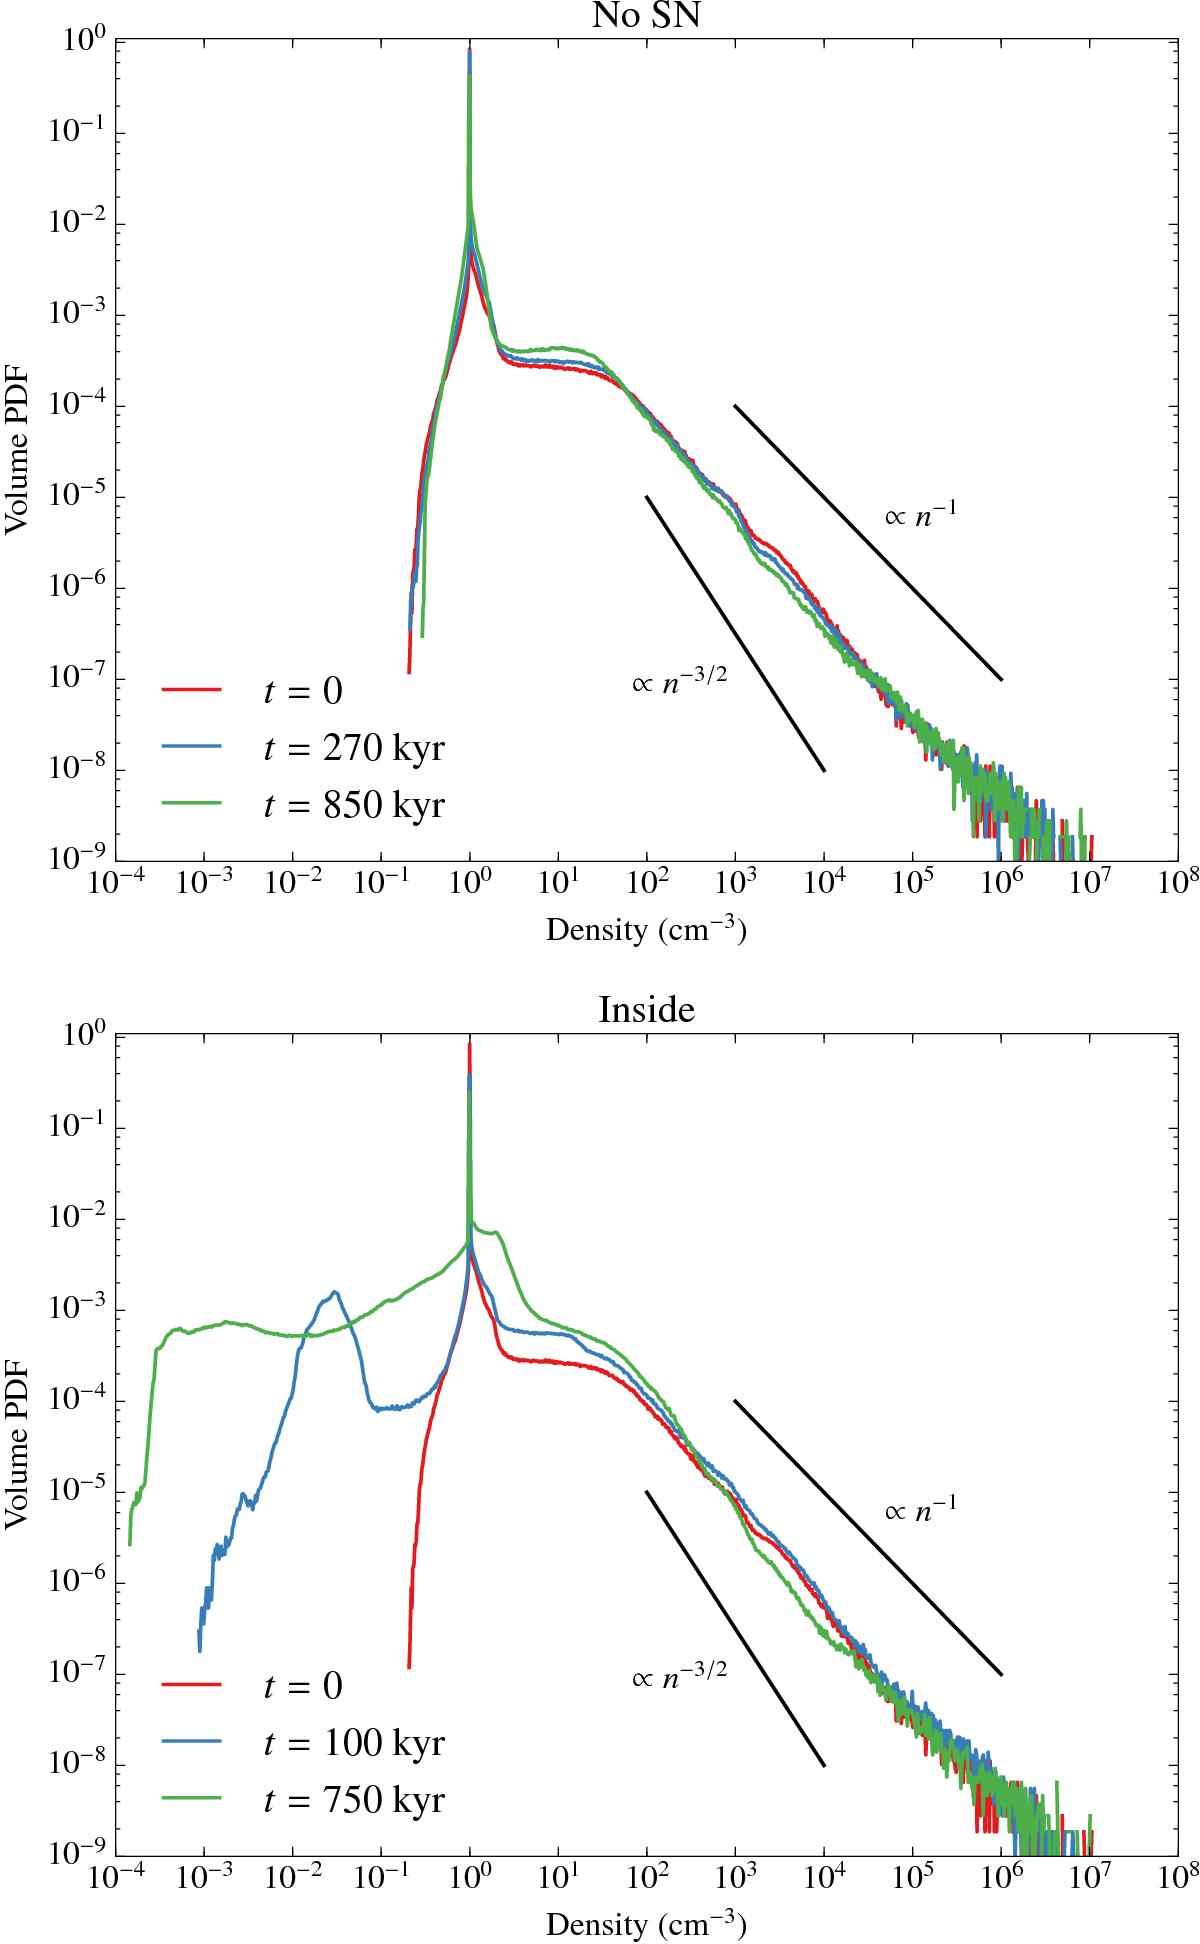
Density probability distribution just before the explosion and at two later times. Top panel: case without supernova and bottom panel: inside run. While significant differences are seen in the diffuse gas distribution, the high-density tail is largely unchanged by the supernova explosions.
This figure is made of several images, please see below:
Current usage metrics show cumulative count of Article Views (full-text article views including HTML views, PDF and ePub downloads, according to the available data) and Abstracts Views on Vision4Press platform.
Data correspond to usage on the plateform after 2015. The current usage metrics is available 48-96 hours after online publication and is updated daily on week days.
Initial download of the metrics may take a while.