Free Access
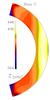
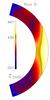
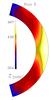
Fig. 3
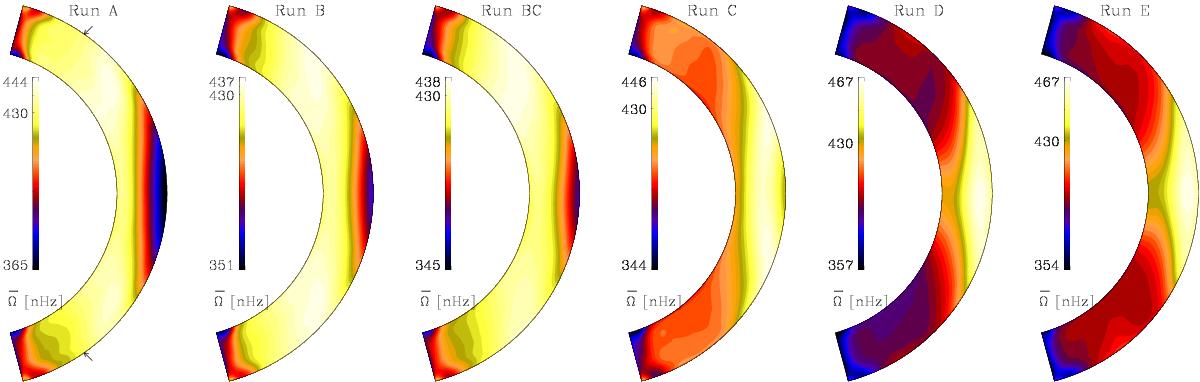
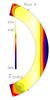
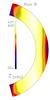
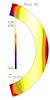
Distribution of angular velocity ![]() in the meridional plane from Runs A–E. The
in the meridional plane from Runs A–E. The ![]() is computed from Ω first by the longitudinal average and then the time average over the last few cycles. The arrows in the leftmost panel show the colatitudes at which the latitudinal differential rotation is computed in Eq. (13).
is computed from Ω first by the longitudinal average and then the time average over the last few cycles. The arrows in the leftmost panel show the colatitudes at which the latitudinal differential rotation is computed in Eq. (13).
This figure is made of several images, please see below:
Current usage metrics show cumulative count of Article Views (full-text article views including HTML views, PDF and ePub downloads, according to the available data) and Abstracts Views on Vision4Press platform.
Data correspond to usage on the plateform after 2015. The current usage metrics is available 48-96 hours after online publication and is updated daily on week days.
Initial download of the metrics may take a while.