Fig. 9
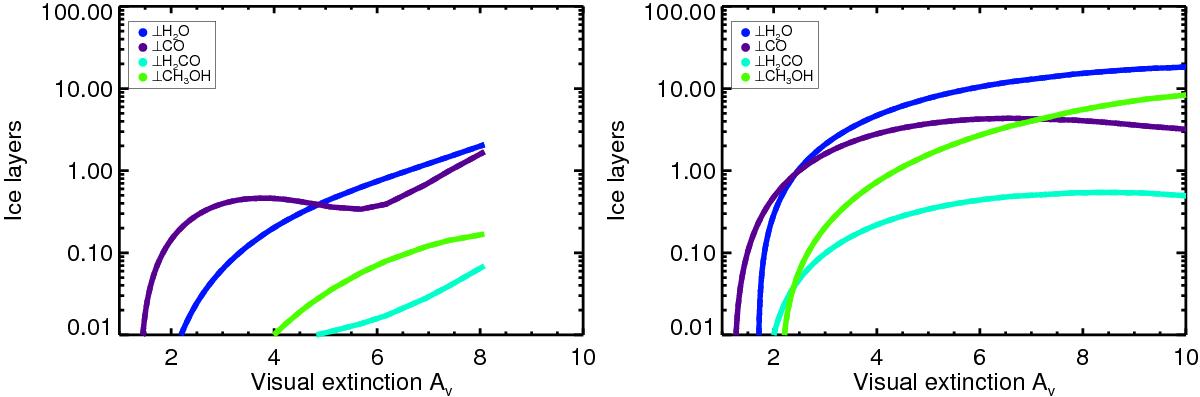
Distribution of ices in and around a molecular clump. The amount of ice layers covering the surface of dust for several species is plotted as a function of visual extinction. The left panel displays the environment of a clump at a time of t = 1.66 × 10⁷ yr of cloud evolution. The right panel shows a time snapshot of the clump after t = 1.82 × 10⁷ yr of cloud evolution. The colored curves are least-squares fits to simulation data points.
Current usage metrics show cumulative count of Article Views (full-text article views including HTML views, PDF and ePub downloads, according to the available data) and Abstracts Views on Vision4Press platform.
Data correspond to usage on the plateform after 2015. The current usage metrics is available 48-96 hours after online publication and is updated daily on week days.
Initial download of the metrics may take a while.