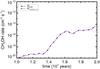
Fig. 6
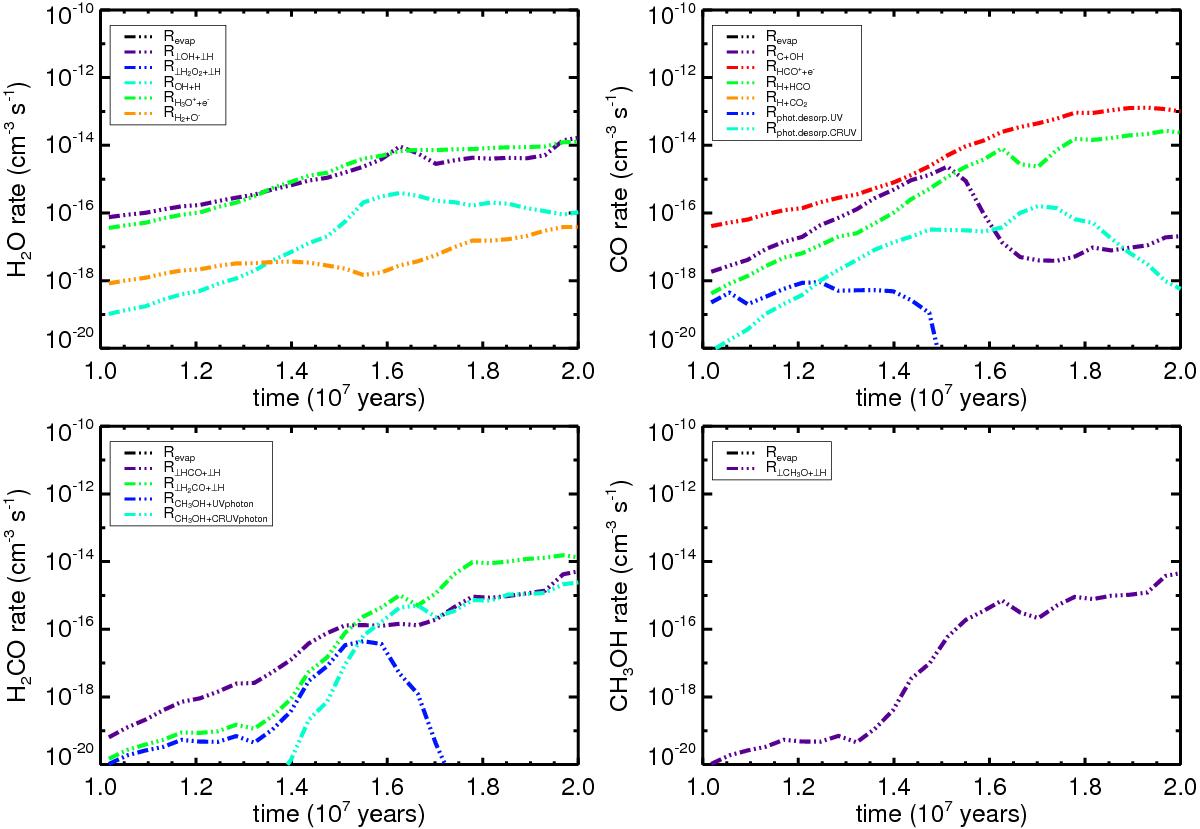
Formation rates of gas-phase species. The main formation rates of H2O (top left), CO (top right), H2CO (bottom left), and CH3OH (bottom right) are plotted as a function of time in 107 yrs. Revap, the evaportation rate, is drawn for each specie, however, this rate is quite low for methanol such that the line does not fall within the limits of the plot. Other molecular reactions as well as photo-processes that result in the four mentioned species are given within the legend.
Current usage metrics show cumulative count of Article Views (full-text article views including HTML views, PDF and ePub downloads, according to the available data) and Abstracts Views on Vision4Press platform.
Data correspond to usage on the plateform after 2015. The current usage metrics is available 48-96 hours after online publication and is updated daily on week days.
Initial download of the metrics may take a while.