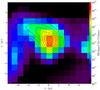
Fig. 10
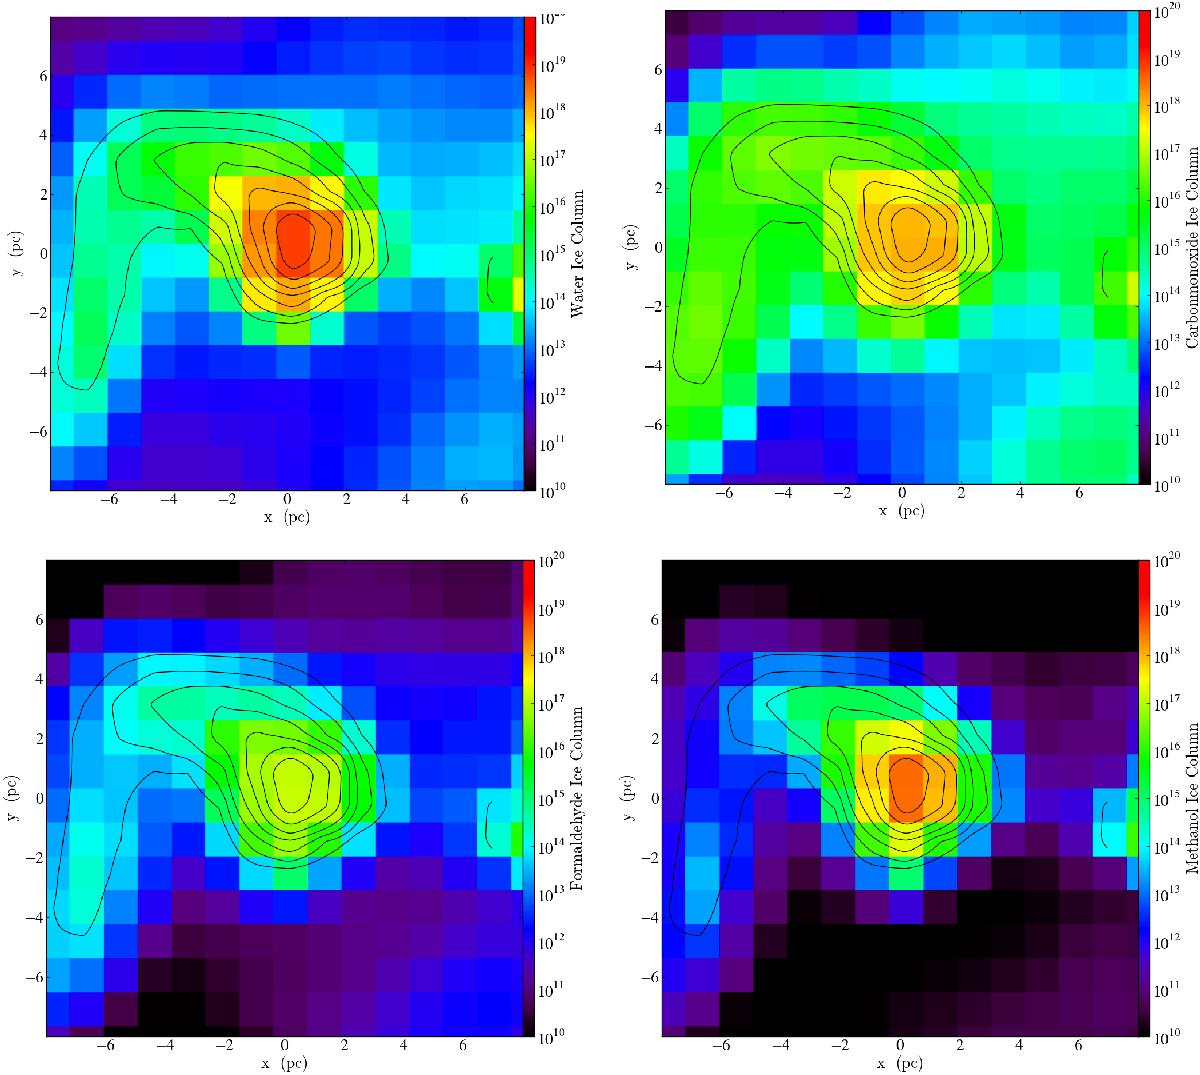
Ice maps. In these images, a projection along the Z-axis, resulting in a line-of-sight column (cm-2), is plotted within a 16 × 16 pc box. From top left to bottom right, ice maps of the species ⊥H2O, ⊥CO, ⊥H2CO, and ⊥CH3OH are displayed. The color range representing the species column densities spans from low 1010 (black) cm-2 to high 1020 cm-2 (red) values. The contours enclose the region where the total column density, ![]() , ranges from 1022 to 6 × 1022 cm-2, i.e., AV = 4.5−27, to indicate where most of the matter lies.
, ranges from 1022 to 6 × 1022 cm-2, i.e., AV = 4.5−27, to indicate where most of the matter lies.
Current usage metrics show cumulative count of Article Views (full-text article views including HTML views, PDF and ePub downloads, according to the available data) and Abstracts Views on Vision4Press platform.
Data correspond to usage on the plateform after 2015. The current usage metrics is available 48-96 hours after online publication and is updated daily on week days.
Initial download of the metrics may take a while.