| Issue |
A&A
Volume 576, April 2015
|
|
|---|---|---|
| Article Number | A30 | |
| Number of page(s) | 22 | |
| Section | Stellar structure and evolution | |
| DOI | https://doi.org/10.1051/0004-6361/201424396 | |
| Published online | 19 March 2015 | |
New NIR light-curve templates for classical Cepheids⋆
1 Dipartimento di FisicaUniversità di Roma Tor Vergata, via della Ricerca Scientifica 1, 00133 Rome, Italy
e-mail: This email address is being protected from spambots. You need JavaScript enabled to view it.
2 European Southern Observatory, Karl-Schwarzschild-Str. 2, 85748 Garching bei Munchen, Germany
3 Department of Astronomy, School of Science, The University of Tokyo, 7-3-1 Hongo, Bunkyo-ku, Tokyo 113-0033, Japan
4 INAF–OAR, via Frascati 33, 00040 Monte Porzio Catone, Rome, Italy
5 Observatories of the Carnegie Institution of Washington 813 Santa Barbara Street, Pasadena 91101, Los Angeles, USA
6 INAF–Osservatorio Astronomico di Collurania, via M. Maggini, 64100 Teramo, Italy
7 Departamento de Astronomia, Universidad de Concepciòn, Casilla 160-C Concepciòn, Chile
8 Koninklijke Sterrenwacht van van België, Ringlaan 3, 1180 Brussel, Belgium
9 Astronomical Institute, Graduate School of Science, Tohoku University, 6-3 Aramaki, Aoba-ku, Sendai, 980-8578 Miyagi, Japan
10 South African Astronomical Observatory, PO Box 9, Observatory 7935 Cap Town, South Africa
11 Department of Physics and Astronomy, N283 ESC, Brigham Young University, Provo, UT 84601, USA
12 Astronomical Institute Anton Pannekoek, Science Park 904, PO Box 94249, 1090 GE Amsterdam, The Netherlands
13 Department of Astrophysics, Nagoya University, Furo-cho, Chikusa-ku, 464-8602 Aichi, Nagoya, Japan
14 Department of Physics and Astronomy, Graduate School of Science and Engineering, Kagoshima University, 1-21-35 Korimoto, 890-0065 Kagoshima, Japan
15 Institute of Astronomy, School of Science, The University of Tokyo, 2-21-1 Osawa, Mitaka, 181-0015 Tokyo, Japan
16 INAF–Oss. Astr. di Trieste, via Tiepolo 11, 34131 Trieste, Italy
17 Warsaw University Observatory, Al. Ujazdowskie 4, 00-478 Warszawa, Poland
Received: 13 June 2014
Accepted: 12 October 2014
Abstract
Aims. We present new near-infrared (NIR) light-curve templates for fundamental (FU, J, H, KS) and first overtone (FO, J) classical Cepheids. The new templates together with period-luminosity and period-Wesenheit (PW) relations provide Cepheid distances from single-epoch observations with a precision only limited by the intrinsic accuracy of the method adopted.
Methods. The templates rely on a very large set of Galactic and Magellanic Cloud Cepheids (FU, ~600; FO, ~200) with well-sampled NIR (IRSF data set) and optical (V, I; OGLE data set) light-curves. To properly trace the change in the shape of the light-curve as a function of pulsation period, we split the sample of calibrating Cepheids into ten different period bins. The templates for the first time cover FO Cepheids and the short-period range of FU Cepheids (P ≤ 5 days). Moreover, the phase zero-point is anchored to the phase of the mean magnitude along the rising branch. The new approach has several advantages in sampling the light-curve of bump Cepheids when compared with the canonical phase of maximum light. We also provide new empirical estimates of the NIR-to-optical amplitude ratios for FU and FO Cepheids. We perform detailed analytical fits using seventh-order Fourier series and multi-Gaussian periodic functions. The latter are characterized by fewer free parameters (nine vs. fifteen).
Results. The mean NIR magnitudes based on the new templates are up to 80% more accurate than single-epoch NIR measurements and up to 50% more accurate than the mean magnitudes based on previous NIR templates, with typical associated uncertainties ranging from 0.015 mag (J band) to 0.019 mag (KS band). Moreover, we find that errors on individual distance estimates for Small Magellanic Cloud Cepheids derived from NIR PW relations are essentially reduced to the intrinsic scatter of the adopted relations.
Conclusions. Thus, the new templates are the ultimate tool for estimating precise Cepheid distances from NIR single-epoch observations, which can be safely adopted for future interesting applications, including deriving the 3D structure of the Magellanic Clouds.
Key words: stars: variables: Cepheids / stars: distances / stars: oscillations
Full Tables 2 and 4 are available in electronic form at http://www.aanda.org
© ESO, 2015
1. Introduction
Radially pulsating variables, and in particular RR Lyrae and classical Cepheids, play a key role in modern astrophysics because they are robust primary distance indicators and solid tracers of old (t ~ 10−12 Gyr) and young (t ~ 10−300 Myr) stellar populations, respectively. The radially pulsating variables when compared with canonical stellar tracers have the key advantage of being easily recognized by their characteristic light-curves and to provide firm constraints on the metallicity gradient and the kinematics of both the thin disk (Pedicelli et al. 2009; Luck & Lambert 2011; Luck et al. 2011; Genovali et al. 2013) and the halo (Kinman et al. 2012). The above evidence applies not only to the Galaxy, but also to nearby resolved stellar systems (Minniti et al. 2003).
The main drawback in using classical Cepheids is that they have periods ranging from one day to several tens of days. This means that identifying and characterizing them is demanding from the observational point of view. An unprecedented improvement on the number of known radially pulsating variables was indeed provided by microlensing experiments (MACHO, EROS, OGLE) as a byproduct of their large-area surveys. In particular, the ongoing OGLE IV project became a large-scale, long-term, sky-variability survey, and will further increase the variable star identification in the Galactic bulge and in the Magellanic Clouds (OGLE IV, Soszyński et al. 2012). These surveys have been deeply complemented by large experiments aimed at detecting variable phenomena covering a significant fraction of the Southern Sky, either in the optical, such as the ASAS Survey (Pojmanski 2002), the QUEST Survey (Vivas et al. 2004), the NSVS survey (Kinemuchi et al. 2006), the LONEOS Survey (Miceli et al. 2008), the Catalina Real-time Transient survey (Drake et al. 2009), the SEKBO survey (Akhter et al. 2012) and the LINEAR Survey (Palaversa et al. 2013); or in the near-infrared (NIR), such as the IRSF (Ita et al. 2004), the VVV (Minniti et al. 2010); or in the mid-infrared (MIR) such as the Carnegie RRL Program (CRRLP; Freedman et al. 2012).
The intrinsic feature of current surveys is that both the identification and the characterization is performed in optical bands, since the pulsation amplitude is typically larger in the B-band than in the NIR bands. However, recent theoretical (Bono et al. 2010) and empirical (Storm et al. 2011a,b; Inno et al. 2013; Groenewegen 2013) evidence indicates that NIR and MIR photometry has several indisputable advantages when compared with optical photometry: a) it is minimally affected by metallicity dependence (Bono et al. 2010; Freedman & Madore 2010); b) it is minimally affected by reddening uncertainties; and c) the luminosity amplitude is a factor of 3–5 smaller than in optical bands. This means that NIR observations are not very efficient in identify new variables, but they play a crucial role in heavily reddened regions (Matsunaga et al. 2011, 2013). Moreover, accurate mean NIR and MIR magnitudes can be provided even with a limited number of phase points, because of their reduced luminosity amplitudes in this wavelength regime. However, NIR and MIR ground-based observations are even more time-consuming than optical observations, because of sky subtraction. This is the reason why during the past 20 yr NIR light-curve templates have been developed for RR Lyrae (Jones et al. 1996) and classical Cepheids (Soszyński et al. 2005; Pejcha & Kochanek 2012). The key advantage of this approach is that variables for which the pulsation period, the epoch of maximum, and the B- and/or the V-band amplitude are available, a single-epoch NIR measurement is enough to provide accurate estimates of their mean NIR magnitudes, which can then be used to compute their distances.
The most recent Cepheid NIR light-curve template was published by Soszyński et al. (2005, hereinafter S05). They used 30 Galactic and 31 Large Magellanic Cloud (LMC) calibrating Cepheids and provided analytical Fourier fits in the J, H, and K bands by using two period bins for Galactic (0.5 < log P ≤ 1.3 and log P > 1.3) and LMC (0.5 < log P ≤ 1.1 and log P > 1.1) Cepheids.
We derived new sets of NIR light-curve templates for classical Cepheids covering the entire period range (0.0 < log P ≤ 1.8). The advantages of the current approach compared with previous NIR templates available in the literature are the following:
-
a)
Statistics – We collected optical and NIR accurate photometryfor more than 180 Galactic and 500 MagellanicCloud Cepheids. Among these data, we selected the light curvescharacterized by full phase coverage and high photometricquality in the V, J, H and KS bands. We ended up with a sample of more than 200 calibrating Cepheids. This sample is a three times larger than the sample adopted by S05. The sample size enabled us to split the calibrating Cepheids into ten period bins ranging from one day to approximately 100 days;
-
b)
Hertzsprung progression – The sample size allowed us to properly trace the change in light-curve morphology across the Hertzsprung progression (HP). Cepheids in the period range 6 <P< 16 days show a bump along the light-curves. The HP indicates the relation between this secondary feature and the pulsation period: the bump crosses the light-curve from the decreasing branch to the maximum for periods close to the center of the HP and moves to earlier phases for longer periods. To properly trace the change in the shape of the light curve, we adopted a new anchor for the phase zero-point. The classical approach was to use the phase of maximum light of optical light curves to phase the NIR light-curves. The use of the phase of maximum light as zero-point (φ = 0) was justified by the fact that the photometry was more accurate along the brighter pulsation phases. However, this anchor has an intrinsic limit in dealing with bump Cepheids. At the center of the HP the optical light-curves are either flat topped or show a double peak. This means that from an empirical point of view it is quite difficult to identify the phase of maximum light. Moreover, the center of the HP is metallicity dependent (see Sect. 2.1). To overcome this problem, we decided to use the phase of the mean magnitude along the rising branch. This phase zero-point can be easily estimated even if the light-curve is not uniformly sampled;
-
c)
First overtones – We derived for the first time the template for first overtone Cepheids in the J band;
-
d)
Analytical fit – Together with the classical analytical fits based on Fourier series we also provide a new analytical fit based on periodic Gaussian functions. The key advantage in using the latter functions is that the precision is quite similar to the canonical fit, but the number of parameters decreases from fifteen to nine.
The structure of the paper is the following: in Sect. 2 we discuss in detail the different samples of calibrating light curves we adopted to derive the template for fundamental (FU) and first overtone (FO) Cepheids. In particular, in Sect. 2.1 we describe the new technique adopted for phasing and merge the light-curves. The preliminary analysis of the calibrating NIR light-curves and the development of the template is described in Sect. 3, while the analytical formula are given in Sect. 4. In Sect. 5, we discuss in detail the NIR-to-optical amplitude ratios that we adopted to apply the new templates. Section 6 describes the application of the templates and with the error budget associated with the new templates. Finally, in Sect. 7 we summarize the results of this investigation and briefly outline possible future developments.
2. Optical and NIR data sets for calibrating Cepheids
Our analysis is based on the largest available sample of fundamental-mode Cepheids with well-covered light-curves in the NIR and in optical (V, I) bands. This sample covers a very broad period range (1–100 days). We collected J, H, and KS band observations from four different data sets: Laney & Stobie (1992, 51) and Monson & Pierce (2011, 131) for Galactic Cepheids, Persson et al. (2004, 92) for LMC Cepheids, and the IRSF survey catalog for ~500 Small Magellanic Cloud (SMC) Cepheids.
The optical (V, I) light-curves for the Galactic Cepheids were collected from the literature (Laney & Stobie 1992; Berdnikov & Turner 2004, and references therein)1, while for Magellanic Cloud Cepheids we adopted the data from the OGLE III Catalog of Variable Stars (Soszyński et al. 2008, 2010)2. When compared with the other microlensing surveys mentioned in the previous section, the OGLE III Catalog provides very accurate V- and I-band light-curves, with the typical photometric error associated with individual measurements ≤0.008 mag and ≤0.006 mag for I and V bands, respectively. Moreover, the sky coverage of the OGLE III survey fully matches the coverage by the IRSF survey.
-
i)
Calibrating Cepheids in the IRSF/OGLE sample (SMC) During the past few years, the IRSF Survey (Itaet al., in prep.) collected more than ~500 complete NIR light-curves (571 J, 434 H, 219 KS) for SMC Cepheids. These Cepheids have optical (V, I) mean magnitudes, periods, amplitudes, and positions from the OGLE III Catalog of Variable Stars (Soszyński et al. 2010). Typically we have more than 1000 measurements in the optical and at least 100 in NIR bands for SMC Cepheids. This means that phasing optical and NIR light-curves is relatively simple. The photometric accuracy of the data in the IRSF catalog is ±0.02 mag for the brightest (J ≈ 13) and ±0.06 mag for the faintest (J ≈ 17) Cepheids. To improve the quality of the calibrating sample, we performed a selection based on the root mean square (rms) between the individual data points and the analytical fit of the individual light-curves. We adopted a seventh-order Fourier series and the selection criterion
 , where AJ is the pulsation amplitude in the J band (AJ = Jmax − Jmin). The rms /AJ ratio is an indication of how strongly the photometric errors of the individual observations affect the shape of the light-curve. The threshold we chose allows us to select the most accurate light-curve while keeping a statistically significant sample for each bin. However, small changes of the adopted values do not significantly affect our results. The selection criterion was relaxed to
  for the H- and KS-band light-curves, because the amplitude decreases with increasing wavelength. For Cepheids with shortest period Cepheids (1−3 days) we selected the light-curves with
  . The data for these fainter Cepheids are characterized by larger photometric errors. The J, H, KS measurements were transformed into the 2MASS NIR photometric system following Kato et al. (2007). However, the corrections adopted for the transformations between different NIR photometric system transformations are smaller than a few hundredths of magnitude and affect neither the shape nor the amplitude of the light curves.
Fig. 1 Period distribution for the calibrating Cepheids in our sample for the three different bands J (top), H (middle), and KS (bottom). The color coding indicates different data sets (red: MP sample; blue: LS sample; green: SMC sample; orange: P04 sample). The total number of calibrating Cepheids per data set are also labeled. See text for more details.
-
ii)
Calibrating Cepheids in the Persson et al. 2004 sample (P04) This sample is based on the J, H, and K light-curves for 92 Cepheids in the LMC published by Persson et al. (2004, P04) and the V and I photometric data available in the OGLE Catalog for 60 of them. The photometric precision of the data in the P04 catalog is ±0.02 mag for the brightest (J ≈ 12) and ±0.06 mag for the faintest (J ≈ 14) Cepheids. We included Cepheids with complete coverage of the light-curve in the three bands (more than 20 phase points) and with low rms (i.e. ≤0.4 mag in the J band), for a total of ~30 selected Cepheids in the P04 sample. These Cepheids have periods between 6 and 50 days, thus increasing the number of calibrating Cepheids (≳50%) in the long-period regime (see Fig. 1). To transform the NIR measurements from the original LCO photometric system into the 2MASS photometric system, we adopted the relations given by Carpenter (2001).
-
iii)
Calibrating Cepheids in the Laney & Stobie sample (LS) This sample includes 51 Galactic Cepheids with optical and NIR light curves with periods ranging from 3 to 69 days (Laney & Stobie 1992, 1994). This is the most accurate photometric sample for Classical Cepheids available in literature, with intrinsic errors ranging from about ±0.004 mag for the brightest (J ≈ 3) to ±0.011 mag for the faintest (J ≈ 8). The optical light curves are also highly accurate, with typical values of the
 . However, we still performed a selection based on the number of available phase points (we need at least 15 measurements for the Fourier fit) in the optical and the NIR light-curves, for a total of ~30 selected Cepheids in the LS sample. The J, H, KS measurements in Laney & Stobie (1992) are in the SAAO photometric system. We have converted them into the 2MASS photometric system by applying the transformation equations given by Carpenter (2001).
 -
iv)
Calibrating Cepheids in the Monson & Pierce sample (MP) This sample is based on NIR photometric measurements for 131 northern Galactic Cepheids (Monson & Pierce 2011). These Cepheid light-curves are sampled with an average of 22 measurements per star with an associated photometric error of ±0.015 mag. However, we selected only the light curves with more than 17 measurements in each NIR band, for a total of 64, 72, and 93 light-curves in the J, H, and KS bands, respectively. The original J, H, KS data were taken in the BIRCAM system and transformed into the 2MASS photometric system by applying the equations given by Monson & Pierce (2011). For all the Cepheids in this sample, V and I light curves were collected from the literature (Berdnikov & Turner 2004, and references therein). We did not perform any selection on the optical light-curves, because no high accuracy in the V-band data is required by our method. However, the rms is always better than
 for all the Cepheids in this sample.
In total, we collected a sample of light-curves that includes more than 200 calibrating Cepheids and is three times larger than the sample adopted by S05 (60 Cepheids) to derive the NIR light-curve templates for classical Cepheids.
To further improve the sampling of the light curve over the entire period range and to reduce the rms of the light-curve templates, the sample of Galactic and Magellanic calibrating Cepheids was split into ten period bins.
Note that the approach we adopted is completely reddening independent. In particular, the period is the safest diagnostic to bin the calibrating sample, because it can be easily measured with high accuracy, it does not depend on the wavelength, and it is not affected by reddening. This means that the binning in period will not introduce any systematic effect when combining optical and NIR photometric data from different instruments. Moreover, theoretical predictions (Marconi et al. 2005) clearly show that the light-curve shape changes with the mass at fixed chemical composition and luminosity and that the period is the best observable to account for this trend.
The adopted period ranges and the number of calibrating Cepheids per bin are listed in Table 1.
Adopted period bins.
There are typically twenty Cepheids per period bin with two exceptions: bin 1 (P ≤ 3 days), for which we have fewer than a dozen objects, and bin 5 (9.5 ≥ P< 10), for which the number of Cepheids ranges from 11 (J-band) to 13 (KS band). Figure 1 shows the histograms of the calibrating Cepheids in J (top), H (middle) and in the KS (bottom) band. Cepheids belonging to different data sets are plotted with different colors.
A similar selection was also performed for FO Cepheids. The IRSF monitoring survey collected ~231 complete NIR light-curves for FO Cepheids (231 J, 85 H, 10 KS) with periods ranging from 0.8 to 4 days. We selected from those the calibrating light curves by adopting the following criterion: rmsJ≤ . Again, the threshold was chosen to guarantee the good photometric quality of the calibrating light curves. However, because of the limited photometric accuracy of individual measurements compared with FU light-curves, the final sample of calibrating FO Cepheids only includes ten J-band light curves, with periods ranging from 1.4 to 3.5 days. We did not apply any binning in period for FO Cepheids, because the shape of the light-curve in this period range is almost exactly sinusoidal.
2.1. Phasing the light-curves
Precise period determinations are required to derive correct phase shifts between optical and NIR light curves. The constraint is less severe if optical and NIR time-series data are collected in the same time interval. The V and I photometric data for Galactic Cepheids cover a time interval that ranges from several years to more than 20 yr. Thus, we adopted the new period estimate published by Groenewegen (2013, G13) for all the Cepheids in the LS sample. The G13 sample includes ~130 Galactic Cepheids, and 50% of them are in common with the MP sample. The light curves from MP were phased by adopting the period given in the General Catalog of Variable Stars (GCVS). To check the consistency of the period listed in GCVS, we compared them with periods estimated by using either the Lomb-Scargle algorithm (Press et al. 1989) or the PDM2 (Stellingwerf 2011). The difference between the two sets of periods are about of 10-3 days, thus we adopted the GCVS for all the MP Cepheids not included in the G13 catalog.
The phase of the light-curve is usually defined by  (1)where
  is the epoch of the observation and
  is the epoch of the maximum in the V band. The epoch of maximum in the V and I bands for the LMC and SMC Cepheids is available from the OGLE III catalog, while for the Galactic Cepheids in LS and the 50% in MP we used the epoch of the maximum estimated by G13. To estimate the maximum brightness for the Cepheids for which the epoch of maximum was not available, we fitted the V-band light-curves with a seventh-order Fourier series.
 |
Fig. 2 V-band (left panels) and J-band (right panels) normalized light-curves for Galactic bump Cepheids in the LS sample. The period increases from bottom to top. For all these light-curves the phase φ = 0 was fixed according to the maximum brightness in the V band and was marked with the arrow and the red circle. However, the J-band maximum brightness, marked by the arrow, moves across the light-curves, and occurs at later phases than the optical maximum. The drift in phase arises because the secondary bump can be brighter than the true maximum, that corresponds to the phase of minimum radius along the pulsation cycle. The overplotted orange dots show the position of the mean magnitude along the rising branch, which we adopt as the new phase zero-point (φ = 0). |
The identification of the epoch of maximum in our optical light-curves is straightforward, because of the very accurate time sampling of V- and I-band light-curves of calibrating Cepheids. However, light-curves of extragalactic Cepheids are covered with a limited number of phase points, typically fewer than two dozen (Sandage et al. 2006; Bono et al. 2010; Freedman & Madore 2010). The problem becomes even more severe for bump Cepheids, because the bump moves from the decreasing to the rising branch in a narrow period range. As mentioned above, the light-curve at the center of HP becomes either flat topped or double peaked with the real maximum and the bump located at close phases. Figure 2 shows the normalized optical (V; left) and NIR (J; right) light-curves for three Galactic Cepheids located across the center of the HP and with periods ranging from 7.02 (U Aql, bottom) to 9.84 days(β Dor, top). If we apply the strict definition of epoch of maximum the phase shift between the optical and the NIR light-curve ranges from ~0.1 (β Dor) to ~0.8 (U Aql). The red circles and the red arrows show that the identification of the luminosity maximum is hampered by photometric errors and by the fact that the bump can be brighter than the true maximum that corresponds to the phases of maximum contraction (minimum radius).
The scenario is further complicated because theory (Bono et al. 2000a; Marconi et al. 2005) and observations (Moskalik et al. 1992, 2000; Welch et al. 1997; Beaulieu 1998) indicate that the center of the HP is anticorrelated with the metal content. It moves from 9.5 days for Galactic Cepheids to 10.5 and to 11.0 days for LMC and SMC Cepheids. For a more quantitative analysis of the physical mechanism(s) driving the HP refer to Bono et al. (2002); Marconi et al. (2005) and refer to Soszyński et al. (2008, 2010) for a thorough analysis of the observed light-curves.
To overcome this problem, we decided to use a different zero-point to phase optical and NIR light-curves. Our phase zero-point is defined as the phase of the mean magnitude along the rising branch of the V-band light-curve  (2)We selected this phase point, because the mean magnitudes are more precise than the maximum brightness in Cepheids with modest phase coverage. The new phase zero-point allows us to highly improve the precision of the light-curve template in the period bins located across the bump (bin 4 to 6). A more detailed discussion of the impact of the new phase zero-point is given in Sect. 3.1. The top panel of Fig. 3 shows the comparison between the phase lags of V and J light curves for a sample of SMC Cepheids based on the epoch of the maximum (Eq. (1), black open circles) and on the epoch of the mean (Eq. (2), orange dots). The same comparison for the H and KS-bands are shown in the middle and bottom panels of the same figure. Data plotted in this figure clearly show the advantages in using the epoch of the mean magnitude as the phase zero-point.
 |
Fig. 3 Top: phase lag between the V- and the J-band light-curve of SMC Cepheids. The black open circles are estimated by adopting the epoch of maximum brightness as phase zero-point, while the orange dots by adopting the new phasing, i.e. the epoch of the mean-magnitude along the rising branch. The red lines show the linear fit of the orange data set. The rms (dashed lines) are also overplotted. The values of the medians and of the rms are labeled in the top of the panel. Middle: same as the top, but for the H band. Bottom: same as the top, but for the KS band. |
-
i)
The phase lag anchored to the epoch of the mean can beapproximated by linear relations on a broad period range. Theintercept values of the phase lag are almost zero for all the bandsand it slightly increases from ~0 for the J and H bands to 0.011 for the KS band. The slope also systematically increases from 0.05 for the J band, to 0.08 for the H and 0.09 for the KS bands. Moreover, the standard deviations based on the epoch of the mean magnitude are at least a factor of two smaller than the standard deviations of the phase lags based on the epoch of maximum light (0.02 vs. 0.11 in the J band). Thus, using the epoch of the maximum introduces a spurious shift in the epoch of the maximum of the NIR light-curves of bump Cepheids, and in turn a systematic error in the estimate of their mean NIR magnitudes.
-
ii)
The zero-point and the slopes of the linear relations to predict the phase lag between optical and NIR light-curves are similar for Magellanic and Galactic Cepheids.
-
iii)
The slope of the light-curve’s rising branch is steeper than that of the decreasing branch. This means that the error on the estimate of the mean magnitudes propagates into a smaller error in the phase determination. For this reason, the epoch of the mean along the rising branch provides a more accurate phase zero-point than the phase along the decreasing branch. However, the shape of the light curves changes once again for periods longer than the HP. The rising branch of Cepheids with periods longer than 15.5 days is shallower than the decreasing branch. This means that the latter provides a more solid phase zero-point. However, this problem only affects a minor fraction of our sample (≈ 10%), therefore we adopted the phase of the mean magnitude along the rising branch.
The phase lags between V- and J-band FO Cepheid light-curves are similar to those of the FU Cepheid, with a median value of 0.05.
To estimate the phase of the mean magnitude for the entire sample of calibrating Cepheids, we fit the V-band light-curves transformed into intensity with a seventh-order Fourier series. The mean in intensity was estimated as the constant term of the analytical fit and eventually transformed into magnitude. The comparison with the V-band mean magnitudes provided by Soszyński et al. (2010) by using the same definition indicates that the difference is at most of the order of a few hundredths of magnitude. The luminosity minimum and the luminosity maximum were estimated as the mean of the three closest observed point located across the luminosity maximum and the luminosity minimum of the analytical fit. We adopted this approach because the analytical fit in the period ranges in which the light-curves show secondary features (3 ≤ P ≤ 5 days; 7 ≤ P ≤ 15 days) slightly underestimate the luminosity amplitude. Moreover, the error associated with the amplitude estimated by adopting this approach does not depend on the analytical fit, but is given by the propagation of the photometric error of the observations.
After estimating the epoch of the mean V-band magnitude ( ) for FU and FO calibrating Cepheids, the epoch of the mean magnitude in the NIR bands is given by
  (3)where
  is a constant for the different bands. Its value for FU Cepheids with periods shorter than 20 days is 0.03 (J), 0.07 (H), and 0.13(KS), while for longer periods it is: 0.06 (J), 0.14 (H), and 0.16(KS). The phase lag in the J band for FO Cepheids is 0.05. This equation can also be written in terms of
  and
and  :
:  Thus, the pulsation phase can also be defined as
  (4)where the symbols have their usual meanings. The name, the period, the V, J, H, KS mean magnitudes, the amplitude pulsations, and the epoch of the mean magnitude along the rising branch for the entire sample of calibrating FU Cepheids are listed in Table 2. The same parameters for FO calibrating Cepheids are listed in Table 3.
Pulsation parameters for FU calibrating Cepheids.
Pulsation parameters for FO calibrating Cepheids.
 |
Fig. 4 Merged light-curves (Tbin) for the J (left), H (middle) and KS bands (right) for the ten period bins of FU Cepheids (see Eq. (5) and the following text for more details). The range of periods in days is labeled in the top right corner of the left panel for each bin. The G3 (green line) and the F7 (red line) templates are also shown. |
3. Merged NIR light-curves of calibrating Cepheids
To compute the light-curve template for FU Cepheids in the different period bins, we performed a fit with a seventh-order Fourier series of the V, J, H, KS light curves of the calibrating Cepheids. The analytical fit provides several pulsation parameters: mean magnitude3, pulsation amplitude, and the phase of the mean along the rising branch. The fit with a seventh-order Fourier series is the most often used for Classical Cepheid light-curves (Laney & Stobie 1992; Soszyński et al. 2008, 2010). Analytical fits with lower order Fourier series cause an underestimate of FU Cepheid luminosity amplitudes. On the other hand, higher order analytical fits cause minimal changes (a few thousandths of magnitude) in the luminosity amplitudes and in the mean magnitudes. Following the same approach as adopted by S05, we normalized the light curves in such a way that the mean magnitude is equal to zero and the total luminosity amplitude is equal to one. In particular, for the J band, the normalized light-curve is defined as  (5)where Ji are the individual measurements in the J band, ⟨J⟩ is the mean magnitude and AJ is the luminosity amplitude of the variable in the J band for the lth light-curve.
This approach allowed us to compute the merged light-curve for each period bin ( ). The merged light-curves for the ten period bins in the J (left), H (middle), and KS (right) are shown in Fig. 4. Data plotted in this figure clearly show that current NIR data set properly cover the entire pulsation cycle in the three different bands in the short and the long period range. Moreover, the intrinsic scatter at fixed pulsation phase is quite small and ranges from ~0.03 to ~0.05 over the entire data set. This evidence underlines the photometric precision and homogeneity of the adopted data sets together with the selection of calibrating Cepheids.
We adopted the same approach for the FO calibrating Cepheids. To estimate the main physical parameters, we fit the FO light-curves with a third-order Fourier series, because they have a sinusoidal shape in the adopted period range (see Fig. 5).
F7 and G3 coefficients of the FU NIR light-curve templates and F3 and G2 coefficients of the FO J-band templates.
4. Analytical fits of the merged NIR light-curves of calibrating Cepheids
The precision of the mean NIR magnitudes based on light-curve templates depends on the accuracy of the analytical fits in reproducing the shape of the individual light-curves in the different period bins. The fit of the merged light-curves was performed by using seventh-order Fourier series  (6)Fitting the light curves with Fourier series is a very popular approach for both regular and irregular variables. They have many advantages, but also several limits. In particular, the F7 templates (red lines) for the bin 1 in the J, H, and KS bands – see top panels of Fig. 4 show several spurious ripples along the decreasing branch of the light-curve. Moreover, the F7 templates for the period bins located across the bump display a wiggle close to the phases of maximum brightness (bin 5) and a stiff trend close to the phases of minimum brightness (bin 7).
 |
Fig. 5 Merged light-curve for FO Cepheids. The F3 (red line) and G2 (green line) templates are also shown. |
To provide an independent approach for the analytical modeling of the light curves, we adopted a fit with multiple periodic Gaussian functions ![Mathematical equation: \begin{equation} {\rm G3(\phi)}= \sum_{i\,=\,1}^3 G_i \exp \left[\frac{- \sin \pi (\phi- \Gamma_i)}{\tau_i}\right]^2\cdot \end{equation}](/articles/aa/full_html/2015/04/aa24396-14/aa24396-14-eq98.png) (7)We called these analytical functions PEGASUS, because they provide PEriodic GAuSsian Uniform and Smooth fits. The key advantage of these functions is that they follow the features of the light-curves, but the wings remain stiff. The fits of the calibrating light-curves with the linear combination of three PEGASUS functions are plotted as green lines in Fig. 4 and are very accurate over the entire period range. The fits based on PEGASUS show two indisputable advantages over the Fourier series: a) the PEGASUS fit (G3) only requires nine parameters, while the Fourier fit (F7) needs 15 parameters, and b) the G3 fit does not show the ripples in either the short period bins (bins 1 and 2; see Fig. 4) or across the Hertzsprung progression (bins 4, 6, and 7; see Fig. 6).
(7)We called these analytical functions PEGASUS, because they provide PEriodic GAuSsian Uniform and Smooth fits. The key advantage of these functions is that they follow the features of the light-curves, but the wings remain stiff. The fits of the calibrating light-curves with the linear combination of three PEGASUS functions are plotted as green lines in Fig. 4 and are very accurate over the entire period range. The fits based on PEGASUS show two indisputable advantages over the Fourier series: a) the PEGASUS fit (G3) only requires nine parameters, while the Fourier fit (F7) needs 15 parameters, and b) the G3 fit does not show the ripples in either the short period bins (bins 1 and 2; see Fig. 4) or across the Hertzsprung progression (bins 4, 6, and 7; see Fig. 6).
However, the standard deviations of the individual fits and the errors on the coefficients in G3 and in F7 fits attain similar values. The standard deviations are on average on the order of a few hundredths of magnitude, wile the errors of the coefficients are smaller than one thousandth of magnitude. This is the main reason why we decided to provide the analytical fits for both of them. The coefficients Ai and Φi for the F7 fits and the Gi, Γi and τi coefficients for the G3 templates are given in Table 4.
For the FO light-curve template, we adopted a third-order Fourier (F3) series and a second-order PEGASUS function (G2) to fit the merged light-curves. Figure 5 shows the J-band template for FO Cepheids together with the F3 and the G2 best fits. The rms for the merged light-curve is ~0.07 (F3) and ~0.08 (G2) mag. The coefficients Ai and Φi for the F3 templates and the exponents Gi, Γi, τi for the G2 templates are listed in Table 44.
 |
Fig. 6 From left to right: residuals of the J-band merged light-curves (silver dots) obtained with the new templates: F7 (red line; top) and G3 (green line; bottom) for the period bin 4 (7−9.5 days), bin 6 (10.5−13.5 days) and bin 7 (13.5−15.5 days). The residuals attain vanishing mean values for the F7 and the G3 templates. |
4.1. Validation of the new phase zero-point: bump Cepheids
 |
Fig. 7 Comparison between the merged light-curve |

To improve the mean NIR magnitude of bump Cepheids, we adopted (see Sect. 2.1) a new phase zero-point anchored on the phase of the mean magnitude along the rising branch. Figure 7 shows the comparison between the merged J-band light curve for the period bin 4 computed by using as phase zero-point both the phase of maximum light (Eq. (1), left panel) and the phase of mean magnitude along the rising branch (Eq. (5), right panel). A glance at the data plotted in this figure show that the rms significantly decreases in the merged light-curve that was computed using the new phase zero-point, and the rms decreases by roughly a factor of two (0.06 vs. 0.13).
To further constrain the precision of current templates, we also performed a comparison with the light-curve template provided by S055. The left panel of Fig. 8 shows that the J-band S05 template predicts a shape of the normalized light-curve (left panel, blue line) for Cepheids with period approaching the center of HP (U Aql, P = 7.024) that differs from the observed shape. The difference is quite clear not only close to the phase of the maximum (φ ~ 0.05), but also close to the phase of the bump (φ ~ 0.15), and in particular, along the decreasing branch. The middle and right panels show the comparison between our templates (F7, middle; G3, right) and the observed data.
 |
Fig. 8 From left to right: comparison between the normalized J-band light-curve (black dots) of U Aql and the S05 (blue line; left), F7 (red line; center) and the G3 (green line; right) templates. The typical error associated with observations (±0.01 mag) and rescaled in normalized units is about ~0.001 and is shown in the top left corner of the plot. The residuals between the data and the templates are plotted in the bottom panels. The dashed lines indicates the rms of the residuals; it decreases from 0.10 (S05) to 0.04 (F7, G3). |
The residuals for the S05 template plotted in the bottom left panel of the same figure display a phase delay between the data and the light-curve template along the rising and the decreasing branch. On the other hand, the residuals plotted in the middle and right panels show that the F7 and G3 templates provide a good approximation of the observed light-curve. The residuals have an rms (dashed lines) of 0.04 mag, that is a factor of two smaller than the rms of the S05 template (0.10).
5. NIR-to-optical amplitude ratios
 |
Fig. 9 Top left: amplitude ratios – AJ/AV – as a function of the period for LMC and MW calibrating Cepheids. The dashed vertical lines display the individual bins in period. The color coding is the same as in Fig. 1: orange dots for the P04 sample, red dots for the MP sample, and blue dots for the LS sample. The black solid lines are the mean amplitude ratios estimated on the selected period ranges: P ≤ 20 days and P> 20 days. The error bars in the top left corner show the typical photometric error. Top right: same as the left, but for SMC calibrating Cepheids (green dots). The comparison between the value of the mean ratio in the left and in right panels shows that amplitude ratios of SMC Cepheids are systematically lower than those of LMC+MW Cepheids. Middle: same as the top, but for the AH/AV amplitude ratios. Bottom: same as the top, but for the AKs/AV amplitude ratios. Note that the period ranges for this band are P ≤ 15.5 days and P> 15.5 days. |
The light-curve template allows us to estimate the NIR mean magnitudes from single-epoch observations if the amplitude in that specific band is already known. Indeed, Eq. (5) gives  (8)and similar equations for the other NIR bands (see also Eq. (4) in S05). To estimate the NIR mean magnitudes, the luminosity amplitudes can be estimated by using the luminosity amplitudes in the optical bands. We derived new amplitude ratios between optical and NIR bands by using our calibrating Cepheids. The results are shown in Fig. 9 from top to bottom: AJ/AV, AH/AV, and AKs/AV. We estimated the mean value (black solid line) over two different period ranges: P ≤ 20 days and P> 20 days for the MW+LMC (left panels) and the SMC calibrating Cepheids (right panels).
The data plotted in this figure disclose several interesting features that need to be addressed in more detail, because these ratios are prone to systematic uncertainties. Classical Cepheids are young objects and a significant fraction of them are still members of binary systems (Szabados & Nehéz 2012). Their companions are mainly young low-mass stars, which meant that they mainly affect the V-band amplitude. Moreover, recent accurate optical and NIR interferometric (Kervella et al. 2006), mid-infrared (Marengo et al. 2010; Barmby et al. 2011), and radio (Matthews et al. 2012) measurements indicate the presence of a circumstellar envelope around several Galactic Cepheids. This evidence implies that the NIR amplitudes might also be affected by systematic uncertainties and it accounts for a significant fraction of the dispersion around the mean values because the photometric errors are significantly smaller (see the typical error bars in the top left corners).
Moreover, current theoretical (Bono et al. 2000a) and preliminary empirical evidence (Paczyński & Pindor 2000; Szabados & Klagyivik 2012) indicates that the luminosity amplitudes depend on the metal content. The V-band amplitudes of SMC Cepheids in the short–period range (P ≤ 11 days) are, at fixed period, larger than those of Galactic and LMC Cepheids. The difference is caused by the HP dependence on the metallicity (see Sect. 2.1). The trend is opposite in the long-period range. The difference in the optical amplitude is also clear in the Fourier amplitude of Magellanic and Galactic Cepheids (see Figs. 5 and 2 in Soszyński et al. 2008, 2010; Matsunaga et al. 2013, Fig. 2).
This evidence indicates that solid empirical constraints on the dependence of the luminosity amplitudes on metallicity requires accurate information on individual metal abundances. However, Genovali et al. (2013) did not find, within the errors, any significant dependence on iron abundance, by adopting a homogeneous sample of 350 Galactic and 77 Magellanic Cepheids with precise and homogeneous iron abundances. However, this finding is far from being definitive, because the number of SMC Cepheids for which accurate iron abundances are available is quite limited (19).
The data plotted in the top panel of Fig. 9 indicate that the NIR–to–optical amplitude ratios of SMC Cepheids (right panel) are smaller over the entire period range than the amplitude ratios of MW plus LMC Cepheids (left panel). This is the reason why we decided to adopt independent values for the NIR-to-optical amplitude ratios of SMC and MW plus LMC Cepheids. The high dispersion in the amplitude ratios is mainly due to the V-band amplitude distribution in the Bailey diagram (amplitude vs. period), while the NIR amplitudes show a similar distribution, but tighter. Current theoretical and empirical evidence indicates that the amplitude distribution in the Bailey diagram for Galactic Cepheids has the typical V shape (van Genderen 1974; Bono et al. 2000a; Szabados & Klagyivik 2012; Genovali et al. 2014), with the largest luminosity amplitudes attained in the short- (log P ≤ 1.0 days) and in the long–period (log P ≥ 1.2 days) ranges, while the minimum, at fixed chemical composition, is reached at the center of the HP. This peculiar behavior does not allow a straightforward prediction of the NIR amplitude on the basis of the period. On the other hand, the NIR-to-optical amplitude ratios are almost constant for a broad range of periods, as shown in Fig. 9. In particular, we find that the mean A(J) /A(V), and A(H) /A(V) amplitude ratios are smaller for periods shorter than P ≤ 20 days and larger for periods longer than P> 20 days. For the SMC mean A(K) /A(V) amplitude ratios we chose a different cut in period: P = 15.5 days. The estimated NIR-to-V amplitude ratios for MW+LMC and SMC calibrating Cepheids are listed in Table 5.
We also note that the typical dispersion for the NIR-to-optical amplitude ratios of the MP sample is almost twice as high as that of the LS sample (MP: σ = 0.05; LS: σ = 0.03; J-band). The main reason for this is the photometric quality of V-band light-curves in the MP sample. As already mentioned in Sect. 2, the optical photometry for these Cepheids was collected from the literature, with the source data spanning a long time and coming from different instruments. Indeed, the typical rms for the MP calibrating V-band light-curve is ~0.05 mag, ten times higher than the typical rms for the LS V-band light-curves (~0.005 mag, see also Sect. 2). We also performed a test by adopting different mean amplitude ratios for each period bin and we did not find any significant improvement in the final results.
Similar considerations apply to the use of linear regression to fit the amplitude ratios as a function of the period. A linear relation on the entire period range provides a good approximation for the short-period range, where the ratios are almost constant, but it underestimates the values in the long-period range. On the other hand, by adopting two different relations in the two period ranges, the number of parameters will double without significantly improving the template accuracy compared with the two horizontal lines.
The pulsational amplitudes and Fourier parameters of FO Cepheids also show a sudden jump for periods close to P = 3 days (Kienzle et al. 1999). This behavior is associated with the possible presence of a short-period bump along the light-curves of FO Cepheids with periods between 2 and 3.8 days (Bono et al. 2000a). Thus, we adopted two different A(J) /A(V) mean values for the two different regimes of the amplitude before and after the appearance of this short-period bump. Figure 10 shows the phase lags (top panel) and the amplitude ratios (bottom panel) computed for the FO calibrating Cepheids. The mean values (solid lines) are AJ/AV = 0.40 (P ≤ 2.8 days) and AJ/AV = 0.30 (P> 2.8 days).
NIR-to-optical amplitude ratios.
 |
Fig. 10 Top: phase lags in J band for FO Cepheids based on the epoch of the maximum (black circles) and on the epoch of the mean magnitude along the rising branch (orange dots). The median (solid lines) and rms (dashed lines) of the ten calibrating Cepheids are overplotted. The black labels refer to the epoch of maximum, orange labels to the epoch of the mean magnitude. Bottom: the amplitude ratio A(J) /A(V) for FO Cepheids. The mean values for the two adopted bins in period (P ≤ 2.8, and P> 2.8 days) are also labeled (black solid lines). |
6. Validation of the light-curve templates
To further evaluate the accuracy of current templates, we performed a new test by using the complete light-curves of the calibrating Cepheids. For each period bin, we have several calibrating light-curves (see Fig. 1) for which all the parameters – mean magnitudes, NIR luminosity amplitudes, period, phase zero-points – have already been estimated. Therefore, we randomly selected a phase point from the calibrating light curve to simulate a single-epoch observation and applied the new templates to estimate the mean magnitude, which we then compared with the true one. We define δJ as the difference in J band between the true mean magnitude – estimated as the mean along the light-curve – and the mean magnitude computed by using the new J-band templates. A similar approach was also adopted for the H and KS-bands. Figure 11 shows the δJ for two period bins: bin 3 (top) and bin 4 (bottom) by adopting the F7 (red dots, left panels), the G3 (green dots, middle panels) and the S05 (blue dots, right panels) light-curve templates. The δJ based on both F7 and G3 templates give a vanishing mean (≤ 10-3 mag) and a small standard deviation ~ 0.03 mag. The S05 templates also give a mean close to zero (~ 10-3 mag) and a slightly larger standard deviation (~ 0.04 mag). The data plotted in Fig. 11 show that the residuals of the S05 template are not symmetric, therefore we estimated the interquartile range and found that the difference becomes about 40% (~0.06 vs. ~0.04 mag). We also divided the data into ten phase bins and estimated the mean and standard deviation for each bin. The values are overplotted in Fig. 11 (red dots, F7; green dots, G3; blue dots, S05). The horizontal error bars display the range in phase covered by individual bins, while the vertical error bars display their standard deviations.
 |
Fig. 11 Top: δJ for period bin 3 (5–7 days) by adopting the F7 (red dots, left panel), the G3 (green dots, central panel), and the S05 templates (blue dots, right panel). The gray dots on the background are the difference between the mean magnitude estimated by applying the templates and the true mean magnitude estimate by the individual fits. By binning the phase in ten different bins, we estimated the mean of the residuals (dots) and the standard deviation (error bar). The solid black lines show the mean values, which are <10-3 mag for the three templates. Bottom: same as top, but for period bin 4 (7−9.5 days). |
The data plotted in this figure indicate that the residuals of the F7 and G3 are independent of the phase, while the residuals of the S05 template show a clear phase dependence for φ ~ 0.5 and φ ~ 0.8. In particular, the mean J magnitudes based on the S05 template are 2σ fainter close to φ ~ 0.5 and brighter close to φ ~ 0.8. Most of this discrepancy is due to bump Cepheids for which the phase zero-point anchored on the epoch of maximum brightness introduces systematic phase shifts in using the template. Similar trends were also found when estimating the δH and δKS by applying the F7, G3, and S05 templates. We also performed the same test for FO Cepheids, and the results are plotted in Fig. 12. Once again, the residuals for the F7 and the G3 templates attain vanishing values (≤ 10-3) and the standard deviations are smaller than 0.04 mag. Note that above standard deviations account for the entire error budget, because they include the photometric error (measurements, absolute calibration) and the standard deviations of the analytical fits.
 |
Fig. 12 Same as Fig. 11, but for FO calibrating Cepheids. The δJ are based on the F7 (top) and the G2 (bottom) templates. The red (F3) and green (G2) dots indicate the mean for each of the 20 bins in phase and the standard deviation (error bars). The mean of the residuals is ≤ 0.01, with a mean rms of 0.04 mag. |
6.1. Test based on single-epoch measurements
The validation of the light-curve templates performed in the last section has a limited use, bceause it relies on Cepheids with a good coverage of the pulsation cycle, and in turn on accurate luminosity amplitudes. Therefore, we performed an independent validation by using the amplitude ratios discussed in Sect. 5 and by randomly extracting phase points from the J, H, and KS-band light-curves of the calibrating SMC Cepheids. This is an acid test, because we are mimicking the typical use of the light-curve template.
The difference in mean magnitude between the true mean magnitudes and the mean magnitudes estimated using the new NIR templates are plotted in Fig. 13 as red triangles (F7, left panels), green triangles (G3, middle panels), and blue triangles (S05, right panels). The red, green and light blue shadowed areas indicate the standard deviation ± σ, for the δJ (top), the δH (middle) and the δKS (bottom) estimated with the three different templates. The mean values for the three bands (δJ, δH and δKS) are lower than a few thousandths in all the cases. However, the σ for the F7 and the G3 J and H-band templates are at least 40% lower than for the S05 template (0.03 vs. 0.05 mag). The difference for the KS band is lower and of about ~20% (0.04 vs. 0.05 mag). Moreover, the residuals of the S05 template show a phase dependence that is not present in the residuals of the F7 and the G3 templates6.
 |
Fig. 13 Random-phase extraction test for all the period bins in the different NIR bands (from top to bottom: J, H and KS) in the SMC sample. The red triangles show the difference between the mean magnitude predicted by applying the F7 template to the single-epoch NIR observation (left panel). In the middle panel the green triangles were evaluated by applying the G3 template, while the blue triangles in the left panel are evaluated by applying the S05 template. The shadowed areas shows the 2σ of the results (F7: light red; G3: light green; S05: light blue), while the black lines indicate the zero. The residuals of F7 and G3 template show no dependence on the phase, and the dispersion is from ~20% (KS) to 40%(J) lower than the residuals of the S05 template. |
The evidence that the new NIR templates do not significantly reduce the scatter in the KS band is a consequence of the fact that the pulsation amplitude in this band is smaller than in the J and in the H bands. Moreover, the photometric errors on individual measurements become larger.
We performed the same test for the Galactic calibrating Cepheids, and the results are given in Fig. 14. The difference we found for Galactic calibrating Cepheids from using the new NIR templates is between two (KS) to three (J,H) times smaller than for the S05 templates. The mean in the three different bands approaches zero (~ 10-3 mag), but the residuals of the S05 template show a clear phase dependence. Moreover, data plotted in the right panels show a systematic overestimate of the mean magnitude for phases close to the rising branch (φ ~ 1). The main reason for this discrepancy is once again the adopted phase zero-point. The use of the maximum brightness to anchor the phase causes loose constraints along the rising branch, i.e. close to phases in which the luminosity rapidly increases. The F7 and the G3 templates do not show evidence of similar systematic effects. However, the former exhibits a mild phase dependence in the KS bands – and probably in the H bands – close to φ = 0.8.
 |
Fig. 14 Same as Fig. 13, but for Galactic Cepheids (LS, MP). The red triangles show the difference between the mean magnitude predicted by applying the F7 template (left panel), the G3 template (central panel, green triangles), and the S05 template (right panel, blue triangles). The shadowed areas shows the 2σ of the results (F7: light red; G3: light green; S05: light blue), while the black lines indicate the zero for each data set. |
The difference between the residuals of MW+LMC and SMC calibrating Cepheids is a consequence of the fact the former sample is characterized by a better photometric precision over the entire period range. The mild phase dependence is mainly due to the smaller photometric errors, and in turn, to the smaller standard deviations (see labeled values). The key points to explain the above trends are a) the definition of the phase zero-point: the use of the mean magnitude along the rising branch (Sect. 2.1) instead of the decreasing branch reduces the precision of the template for periods longer than 13.5 days; b) the NIR-to-optical amplitude ratios adopted for the H and KS: the V-band amplitude of the Galactic calibrating Cepheids shows, at fixed period, a high dispersion, that propagates into the NIR-to-optical amplitude ratios.
The same test was also applied to the FO calibrating Cepheids. The residuals plotted in Fig. 15 clearly show that the standard deviation of the J-band template decreases by ~50% when compared with single-epoch measurements extracted along the light-curves. Note that the typical pulsation amplitude in the J band for FO pulsators is ~0.15 mag. This means that the use of single-epoch measurement as a mean magnitude introduces an error of about ~0.07 mag. Thus, the new FO NIR templates allow us to reduce the error budget for FO Cepheids by almost a factor of two. Moreover, the new templates do not show evidence of a phase dependence.
To fully exploit the impact of the new NIR templates on FU Cepheids, we also performed a test with the mean Wesenheit magnitudes. The NIR Wesenheit magnitudes are closely related to apparent magnitudes, but they are minimally affected by uncertainties on reddening and are defined as  where the coefficients of the color terms are based on the reddening law provided by Cardelli et al. (1989), and for the SMC selective absorption coefficient we adopted RV = 3.23. This is an acid test concerning the NIR templates, since the color coefficients of the Wesenheit relations attain values higher than one for bands with limited difference in central wavelength. This means that uncertainties affecting the mean colors are magnified in using Wesenheit relations.
To simulate the effect of non-simultaneous NIR observations, we randomly extracted for the entire set of SMC calibrating light-curves three different (J, H, KS) measurements. The NIR templates were applied to each of them and we obtained three independent estimates of the mean NIR magnitudes. Then we computed the three mean Wesenheit magnitudes – W(JH), W(HKS), W(JKS) – by using these relations and estimated the difference in magnitude with the true mean Wesenheit magnitudes. To properly sample the luminosity variations along the entire pulsation cycle, the procedure was repeated ten times per light-curve. This test was performed with the new (F7, G3) and the S05 templates. The residuals are plotted in Fig. 16, W(JKS) (top), W(HKS) (middle) and W(JH) (bottom). A Gaussian fit to the histograms performed to evaluate the mean and the standard deviation is also overplotted. We found that the means once again vanished. The σ of the mean Wesenheit magnitudes based on the F7 (a) panels) and on the G3 (b) panels) templates are between 15−30% lower than the σ of the residuals based on the S05 (c) panels) template (see labeled values).
Finally, we also compared the difference between the mean Wesenheit magnitudes based on the new NIR templates with single-epoch measurements randomly extracted from the light-curve of the SMC calibrating Cepheids. The gray shaded areas plotted in the d) panels of Fig. 16 show that the standard deviations of the new NIR templates are a factor of two smaller than those of the single-epoch measurements.
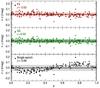 |
Fig. 15 Random-phase extraction for FO calibrating Cepheids in the J-band. The red triangles show the differences between the mean magnitude based on the F3 template and on single-epoch NIR observations (top panel). The middle panel shows the residuals (green triangles) based on the G2 template, while the bottom panel shows the residuals (black triangles) of the single-epoch measurements. The shadowed areas shows the 2σ of the results (F7: light red; G2: light green; single-epoch: light gray), while the black lines display the mean. |
 |
Fig. 16 Top: from left to right: histogram of the difference between the true mean Wesenheit W(JKS) and the mean Wesenheit magnitude estimated by using the F7, G3, S05 templates, and the single-epoch data. The single-epoch data were randomly extracted from the calibrating SMC light-curve at different phases for the J, H, and the KS bands. The Gaussian fits from which the labeled standard deviation has been estimated are also overplotted on the histograms. Middle: same as top, but for the W(HKS) magnitude. Bottom: same as top, but for the W(JH) magnitude. |
6.2. Error budget of the analytical fits
These results clearly show that the application of NIR light curve templates increases the accuracy on the mean magnitude compared with single-epoch measurements. However, the templates are affected by several uncertainties that contribute to the total error budget. The test discussed in Sect. 6.1 and shown in Fig. 13 was also applied to constrain the impact of the individual uncertainties on the total dispersion of the δJ, δH, and δKS residuals.
-
i)
Photometric error – The photometric error is the main source oferror, and it affects the precision of the template and itsapplication. However, only the former source should be takeninto account when estimating the precision of current templates.To artificially remove the photometric error on the measured NIRmagnitudes, we extracted the individual measurements from theFourier fits of the light-curves. The result of this numericalexperiment shows that 60% of the total dispersion is due to thephotometric error on the observed magnitudes. This accounts for0.02 mag in the total error budget.
-
ii)
Use of the template – The use of a template plus a single-epoch measurement to estimate the mean magnitude accounts for 12% of the total dispersion in Fig. 13.
-
iii)
Merging of the light-curves in period bins – Our approach assumes that all the light-curves inside the same period bin are identical within the errors. This assumption is verified inside the confidence level given by the rms of the merged light-curves, typically ~0.03 mag. However, small differences in shape may occur between the true light-curve of the Cepheid and the given template. This is a simple consequence of the merging process of the Cepheid light-curves in a limited number of period bins. We tested the impact of this approach by using synthetic light-curve based on analytical fits (F7, G3). We found that 15% of the total dispersion is due to the process of merging the light-curves in a modest number of period bins.
-
iv)
V-NIR amplitude ratio – The prediction of the pulsation amplitudes in the J, H, and KS bands based on the optical amplitude introduces an uncertainty on the mean magnitude provided by the templates. However, we can quantify this effect by adopting the true amplitudes measured for the calibrating Cepheids. The error associated with the use of the V-NIR amplitude ratios given in Sect. 5 accounts for 10% of the total budget.
-
v)
V-NIR phase lags – We estimated the epoch of the mean magnitude along the rising branch by adopting V-NIR phase lags (Sect. 2.1). The comparison between the δJ, δH, and δKS residuals estimated with the adopted and the measured epoch of the mean magnitudes indicates that this assumption accounts for ~3% of the error budget.
The error associated with the NIR mean magnitudes estimated by applying the new NIR templates is ~0.015 mag for the J band, 0.017 mag for the H band and 0.019 mag for the KS band. These errors have to be added in quadrature to the photometric error on the single-epoch measurements to which the template is applied. The use of two or more measurements for the same Cepheid and the weighted average of the independent mean magnitudes implies a better precision on the final mean magnitude.
7. Summary and final remarks
We developed new NIR J, H, and KS light-curve templates for FU and FO Cepheids. The new templates compared with those already available in the literature have several advantages:
-
i)
Period binning – We divided the entire period range (1−100 days) into ten different period bins. The binning was performed to a) reduce the rms of the merged light-curves, b) properly trace the change in the shape of the light-curve across the HP, and to c) minimize the discrepancy in the amplitude ratio and in the phase difference (Rl,m, φl,m; Fourier parameters) between templates and individual light curves. The adopted binning in period allowed us to limit this difference to less than 15% of the total error associated with the estimate of the NIR mean magnitudes.
-
ii)
Phase zero-point – The phase zero-point of the mean magnitude was fixed along the rising branch of the light-curve. The main advantage of this new definition is that it allow us to estimate the phase lag between optical and NIR light-curves. Moreover, the identification of the new phase zero-point is straightforward even for bump cepheids and thus overcomes possible systematic errors introduced by the secondary bumps along the light curves.
-
iii)
NIR-to-optical amplitude ratios – To apply the new templates, we need to know the luminosity amplitude in an optical band (V, B) in advance together with the ratio between optical and NIR bands. The optical amplitudes come from the OGLE data set. We provided a new estimate of the V-NIR amplitude ratios for the calibrating Cepheids and found that a) the ratios for SMC Cepheids are, at fixed period, systematically lower than the ratios of Galactic and LMC Cepheids; b) the difference between SMC and MW+LMC decreases for periods longer than the center of the HP. The optical amplitudes of Galactic Cepheids are smaller than the amplitudes of SMC Cepheids for periods shorter than the center of the HP. Therefore, we adopted two different ratios for the short– and the long–period regime.
-
iv)
Analytical functions – Together with the popular seventh-order Fourier series fitting, we also provided a template based on multi-Gaussian periodic functions. The main advantage in using this new template is that it provides a solid fit of the light-curves by using fewer parameters than the Fourier fit. Moreover, it is less sensitive to spurious features that can be introduced in the light-curves by photometric errors and to secondary features (bumps, dips) that can appear along the light-curves.
-
v)
FO pulsators – We provide for the first time the J-band template for FO Cepheids, following the same approach as we adopted for FU Cepheids. The new template reduces the uncertainty on the mean J-band magnitude of FO Cepheids by a factor of two.
The application of the new NIR templates when compared with single-epoch NIR data provides mean magnitudes that are 80% more accurate, and their typical error is smaller than 0.02 mag. Cepheids mean magnitudes can be used to estimate their distances by adopting period-luminosity (PL) and period-Wesenheit (PW) relations. The error associated with these distances includes both the error on the observed mean magnitude and the uncertainty on the absolute magnitude estimated by the adopted relation. This uncertainty is formally derived by the dispersion of the relation, which is produced by three different error sources: the photometric errors associated with the measured mean magnitudes from which the adopted PL or the PW relation is derived, the line-of-sight depth of the galaxy, and the intrinsic scatter. This last term is a consequence of the fact that PL and PW relations do not account for all the physical parameters that contribute to the stellar luminosity, such as temperature, metallicity, helium-content. Recent theoretical predictions (Bono et al. 2000a; Marconi et al. 2005; Fiorentino et al. 2007) and empirical results (Bono et al. 2010; Inno et al. 2013) indicate that the intrinsic dispersion decreases for NIR PW relations. In particular, Fiorentino et al. (2007) predicted a dispersion lower than 0.05 mag for PW(J,K) relation. This uncertainty of ~3% on individual distances is thus the precision that intrinsically limits the method we adopted. The main advantage of the new templates is that they reach the precision limit, even with single-epoch NIR observations. Indeed, for single-epoch measurements with 1% accuracy or better, the error on the mean magnitude is lower than 2%. Computing the sum in quadrature of all these error sources, the dominant term is then the intrinsic scatter of the PW relation.
This means that Cepheid distances can be determined with the highest possible accuracy by using the new templates and one single-epoch NIR observation.
Compared with the S05 templates, F7 and G3 templates have the advantage to be minimally affected by problems in phase dependences, and they provide new NIR mean magnitudes that are more accurate by 30%(KS) to 50% (J). This means that if single-epoch measurements are available with photometric precision better than 0.03 mag, the new templates already reduce the total uncertainty on distances by 20% with respect to the S05 templates. For instance, by applying the new templates to the NIR single-epoch data presented in Inno et al. (2013) for the SMC Cepheids, the total dispersion of the optical-NIR PW relations decreases by up to 30% (i.e. 0.15 mag vs. 0.26 mag, PW(VJ)) when compared to single-epoch data, and up to 5% (i.e. 0.15 mag vs. 0.16 mag PW(VJ)) when compared with the S05 template. Moreover,the total dispersion for PW(VJ) is 0.15 mag, indicating that the scatter due to spatial effects is still significantly larger then the intrinsic dispersion (~3 times larger). This means that Cepheid relative distances can be safely used to derive the three-dimensional structure of the SMC, with an accuracy limited by the total error estimated above that is ≤5%, which corresponds to the physical limit of the method itself.
If we instead consider all of the Cepheids as a statistical ensemble representing the stellar distribution in the galaxy, the mean distances to the SMC as derived from different PW relations can be determined with a precision of up to 0.1% (0.002 mag, PW(VJ)), with the precision scaling as the square root of the number of stars in the ensemble itself (≳2200 Cepheids).
A more detailed discussion on the application of the new templates to derive new MC Cepheids relative distances will be given in a forthcoming paper (Inno et al., in prep.).
Our findings rely on a panoply of Galactic and MC Cepheid light-curves. The new templates and reddening-free optical-NIR PW relations will provide accurate absolute and relative distances. The latter appear very promising, because the intrinsic error is on the order of 1−2 percent. This gives the opportunity to derive 3D structure of nearby stellar systems by using single-epoch NIR observations.
In spite of the substantial improvement in the intrinsic accuracy of the NIR light-curve templates, the observational scenario is far from being complete. Current NIR light-curves did not allow us to derive accurate H- and KS-band templates for FO Cepheids, because of the limited photometric accuracy in the short-period regime (faintest Cepheids). Moreover, we found evidence that the NIR-to-optical amplitude ratios of SMC Cepheids are lower when compared with MW+LMC Cepheids. Current data did not allow us to constrain whether a similar difference is present in addition between MW and LMC Cepheids, because of the limited sample of LMC Cepheids, The new NIR time series data that are being collected by IRSF for MC Cepheids appear a very good viaticum to address these open problems.
Online material
Pulsation parameters for FU calibrating Cepheids.
F7 and G3 coefficients of the FU NIR light-curve templates and F3 and G2 coefficients of the FO J-band templates.
Throughout the paper, mean magnitude means a mean in intensity transformed into magnitude.
The IDL procedure for estimating the mean NIR magnitudes by using the templates is available on the webpage: http://www.laurainno.com/#!idl/c5wp
We applied the S05 templates by using their phase zero-point-the epoch of the maximum- and their NIR-to-optical amplitude ratios.
Note that for this test we only adopted calibrating Cepheids with  , because the S05 template does not include shorter period Cepheids.
Acknowledgments
This work was partially supported by PRIN–INAF 2011 “Tracing the formation and evolution of the Galactic halo with VST” (P.I.: M. Marconi) and by PRIN-MIUR (2010LY5N2T) “Chemical and dynamical evolution of the Milky Way and Local Group galaxies” (P.I.: F. Matteucci). One of us (G.B.) thanks The Carnegie Observatories visitor program for support as science visitor. N.M. acknowledges the support by Grants-in-Aid for Scientific Research (Nos. 23684005 and 26287028) from the Japan Society for the Promotion of Science (JSPS). Support from the Polish National Science Center grant MAESTRO 2012/06/A/ST9/00269 is also acknowledged. W.G. gratefully acknowledges support for this work from the BASAL Centro de Astrofísica y Tecnologías Afines (CATA) PFB-06/2007, and from the Chilean Ministry of Economy, Development and Tourism’s Millenium Science Iniciative through grant IC 120009 awarded to the Millenium Institute of Astrophysics (MAS). We also acknowledge G. Fiorentino for many useful discussions concerning the theoretical predictions on NIR period Wesenheit relations. It is also a pleasure to thank an anonymous referee for his/her supportive attitude and insightful suggestions that helped us to improve the readability of the paper.
References
- Akhter, S., Da Costa, G. S., Keller, S. C., & Schmidt, B. P. 2012, ApJ, 756, 23 [NASA ADS] [CrossRef] [Google Scholar]
- Barmby, P., Marengo, M., Evans, N. R., et al. 2011, AJ, 141, 42 [NASA ADS] [CrossRef] [Google Scholar]
- Beaulieu, J. P. 1998, Mem. Soc. Astron. It., 69, 21 [NASA ADS] [Google Scholar]
- Berdnikov, L. N., & Turner, D. G. 2004, Astron. Astrophys. Trans., 23, 253 [NASA ADS] [CrossRef] [Google Scholar]
- Bono, G., Marconi, M., & Stellingwerf, R. F. 2000a, A&A, 360, 245 [NASA ADS] [Google Scholar]
- Bono, G., Castellani, V., & Marconi, M. 2000b, ApJ, 529, 293 [NASA ADS] [CrossRef] [Google Scholar]
- Bono, G., Castellani, V., & Marconi, M. 2002, ApJ, 565, L83 [NASA ADS] [CrossRef] [Google Scholar]
- Bono, G., Caputo, F., Marconi, M., & Musella, I. 2010, ApJ, 715, 277 [NASA ADS] [CrossRef] [Google Scholar]
- Cardelli, J. A., Clayton, G. C., & Mathis, J. S. 1989, ApJ, 345, 245 [NASA ADS] [CrossRef] [Google Scholar]
- Carpenter, J. M. 2001, AJ, 121, 2851 [NASA ADS] [CrossRef] [Google Scholar]
- Drake, A. J., Djorgovski, S. G., Mahabal, A., et al. 2009, ApJ, 696, 870 [NASA ADS] [CrossRef] [MathSciNet] [Google Scholar]
- Fiorentino, G., Marconi, M., Musella, I., & Caputo, F. 2007, A&A, 476, 863 [NASA ADS] [CrossRef] [EDP Sciences] [Google Scholar]
- Freedman, W. L., & Madore, B. F. 2010, ARA&A, 48, 673 [NASA ADS] [CrossRef] [Google Scholar]
- Freedman, W., Scowcroft, V., Madore, B., et al. 2012, Spitzer Proposal, 90002 [Google Scholar]
- Genovali, K., Lemasle, B., Bono, G., et al. 2013, A&A, 554, A132 [NASA ADS] [CrossRef] [EDP Sciences] [Google Scholar]
- Genovali, K., Lemasle, B., Bono, G., et al. 2014, A&A, 566, A37 [NASA ADS] [CrossRef] [EDP Sciences] [Google Scholar]
- Groenewegen, M. A. T. 2000, A&A, 363, 901 [NASA ADS] [Google Scholar]
- Groenewegen, M. A. T. 2013, A&A, 550, A70 (G13) [NASA ADS] [CrossRef] [EDP Sciences] [Google Scholar]
- Inno, L., Matsunaga, N., Bono, G., et al. 2013, ApJ, 764, 84 [NASA ADS] [CrossRef] [Google Scholar]
- Ita, Y., Tanabé, T., Matsunaga, N., et al. 2004, MNRAS, 347, 720 [NASA ADS] [CrossRef] [Google Scholar]
- Kato, D., Nagashima, C., Nagayama, T., et al. 2007, PASJ, 59, 615 [NASA ADS] [Google Scholar]
- Kervella, P., Mérand, A., Perrin, G., & Coudé du Foresto, V. 2006, A&A, 448, 623 [NASA ADS] [CrossRef] [EDP Sciences] [Google Scholar]
- Kienzle, F., Moskalik, P., Bersier, D., & Pont, F. 1999, A&A, 341, 818 [NASA ADS] [Google Scholar]
- Kinemuchi, K., Smith, H. A., Woźniak, P. R., McKay, T. A., & ROTSE Collaboration 2006, AJ, 132, 1202 [NASA ADS] [CrossRef] [Google Scholar]
- Kinman, T. D., Cacciari, C., Bragaglia, A., Smart, R., & Spagna, A. 2012, MNRAS, 422, 2116 [NASA ADS] [CrossRef] [Google Scholar]
- Jones, R. V., Carney, B. W., & Fulbright, J. P. 1996, PASP, 108, 877 [NASA ADS] [CrossRef] [Google Scholar]
- Laney, C. D., & Stobie, R. S. 1992, A&AS, 93, 93 (LS) [NASA ADS] [Google Scholar]
- Laney, C. D., & Stobie, R. S. 1994, MNRAS, 266, 441 [NASA ADS] [CrossRef] [Google Scholar]
- Luck, R. E., & Lambert, D. L. 2011, AJ, 142, 136 [NASA ADS] [CrossRef] [Google Scholar]
- Luck, R. E., Andrievsky, S. M., Kovtyukh, V. V., Gieren, W., & Graczyk, D. 2011, AJ, 142, 51 [NASA ADS] [CrossRef] [Google Scholar]
- Marconi, M., Musella, I., & Fiorentino, G. 2005, ApJ, 632, 590 [NASA ADS] [CrossRef] [Google Scholar]
- Marconi, M., Molinaro, R., Ripepi, V., Musella, I., & Brocato, E. 2013, MNRAS, 428, 2185 [NASA ADS] [CrossRef] [Google Scholar]
- Marengo, M., Evans, N. R., Barmby, P., et al. 2010, ApJ, 709, 120 [NASA ADS] [CrossRef] [Google Scholar]
- Matsunaga, N., Feast, M. W., & Soszyński, I. 2011, MNRAS, 413, 223 [NASA ADS] [CrossRef] [Google Scholar]
- Matsunaga, N., Feast, M. W., Kawadu, T., et al. 2013, MNRAS, 429, 385 [NASA ADS] [CrossRef] [Google Scholar]
- Matthews, L. D., Marengo, M., Evans, N. R., & Bono, G. 2012, ApJ, 744, 53 [NASA ADS] [CrossRef] [Google Scholar]
- Miceli, A., Rest, A., Stubbs, C. W., et al. 2008, ApJ, 678, 865 [NASA ADS] [CrossRef] [Google Scholar]
- Minniti, D., Borissova, J., Rejkuba, M., et al. 2003, Science, 301, 1508 [Google Scholar]
- Minniti, D., Lucas, P. W., Emerson, J. P., et al. 2010, New Astron., 15, 433 [NASA ADS] [CrossRef] [Google Scholar]
- Monson, A. J., & Pierce, M. J. 2011, ApJS, 193, 12 (MP) [NASA ADS] [CrossRef] [Google Scholar]
- Moskalik, P., Buchler, J. R., & Marom, A. 1992, ApJ, 385, 685 [NASA ADS] [CrossRef] [Google Scholar]
- Moskalik, P., Krzyt, T., Gorynya, N. A., & Samus, N. N. 2000, IAU Colloq. 176: The Impact of Large-Scale Surveys on Pulsating Star Research, ASP Conf. Ser., 203, 233 [NASA ADS] [Google Scholar]
- Paczyński, B., & Pindor, B. 2000, ApJ, 533, L103 [NASA ADS] [CrossRef] [Google Scholar]
- Palaversa, L., Ivezić, Ž., Eyer, L., et al. 2013, AJ, 146, 101 [CrossRef] [Google Scholar]
- Pedicelli, S., Bono, G., Lemasle, B., et al. 2009, A&A, 504, 81 [NASA ADS] [CrossRef] [EDP Sciences] [Google Scholar]
- Pejcha, O., & Kochanek, C. S. 2012, ApJ, 748, 107 [NASA ADS] [CrossRef] [Google Scholar]
- Persson, S. E., Madore, B. F., Krzemiński, W., et al. 2004, AJ, 128, 2239 (P04) [NASA ADS] [CrossRef] [Google Scholar]
- Pojmanski, G. 2002, Acta Astron., 52, 397 [NASA ADS] [Google Scholar]
- Press, W. H., Flannery, B. P., Teukolsky, S. A., & Vetterling, W. T. Numerical recipes in C. The art of scientific computing1989 (Cambridge: University Press) [Google Scholar]
- Romaniello, M., Primas, F., Mottini, M., et al. 2008, A&A, 488, 731 [NASA ADS] [CrossRef] [EDP Sciences] [Google Scholar]
- Sandage, A., Tammann, G. A., Saha, A., et al. 2006, ApJ, 653, 843 [NASA ADS] [CrossRef] [Google Scholar]
- Szabados, L., & Klagyivik, P. 2012, A&A, 537, A81 [NASA ADS] [CrossRef] [EDP Sciences] [Google Scholar]
- Szabados, L., & Nehéz, D. 2012, MNRAS, 426, 3148 [NASA ADS] [CrossRef] [Google Scholar]
- Soszyński, I., Gieren, W., & Pietrzyński, G. 2005, PASP, 117, 823 (S05) [NASA ADS] [CrossRef] [Google Scholar]
- Soszyńnski, I., Poleski, R., Udalski, A., et al. 2008, Acta Astron., 58, 163 [NASA ADS] [Google Scholar]
- Soszyński, I., Poleski, R., Udalski, A., et al. 2010, Acta Astron., 60, 17 [NASA ADS] [Google Scholar]
- Soszyński, I., Udalski, A., Poleski, R., et al. 2012, Acta Astron., 62, 219 [NASA ADS] [Google Scholar]
- Stellingwerf, R. F. 2011, RR Lyrae Stars, Metal-Poor Stars, and the Galaxy, 47 [Google Scholar]
- Storm, J., Gieren, W., Fouqué, P., et al. 2011a, A&A, 534, A94 (S11a) [NASA ADS] [CrossRef] [EDP Sciences] [Google Scholar]
- Storm, J., Gieren, W., Fouqué, P., et al. 2011b, A&A, 534, A95 (S11b) [NASA ADS] [CrossRef] [EDP Sciences] [Google Scholar]
- van Genderen, A. M. 1974, A&A, 34, 279 [NASA ADS] [Google Scholar]
- Vivas, A. K., Zinn, R., Abad, C., et al. 2004, AJ, 127, 1158 [NASA ADS] [CrossRef] [Google Scholar]
- Welch, D. L., Alcock, C., Allsman, R. A., et al. 1997, Variables Stars and the Astrophysical Returns of the Microlensing Surveys, 205 [Google Scholar]
- Zinn, R., Horowitz, B., Vivas, A. K., et al. 2014, ApJ, 781, 22 [NASA ADS] [CrossRef] [Google Scholar]
All Tables
F7 and G3 coefficients of the FU NIR light-curve templates and F3 and G2 coefficients of the FO J-band templates.
F7 and G3 coefficients of the FU NIR light-curve templates and F3 and G2 coefficients of the FO J-band templates.
All Figures
|
Fig. 1 Period distribution for the calibrating Cepheids in our sample for the three different bands J (top), H (middle), and KS (bottom). The color coding indicates different data sets (red: MP sample; blue: LS sample; green: SMC sample; orange: P04 sample). The total number of calibrating Cepheids per data set are also labeled. See text for more details. |
| In the text | |
|
Fig. 2 V-band (left panels) and J-band (right panels) normalized light-curves for Galactic bump Cepheids in the LS sample. The period increases from bottom to top. For all these light-curves the phase φ = 0 was fixed according to the maximum brightness in the V band and was marked with the arrow and the red circle. However, the J-band maximum brightness, marked by the arrow, moves across the light-curves, and occurs at later phases than the optical maximum. The drift in phase arises because the secondary bump can be brighter than the true maximum, that corresponds to the phase of minimum radius along the pulsation cycle. The overplotted orange dots show the position of the mean magnitude along the rising branch, which we adopt as the new phase zero-point (φ = 0). |
| In the text | |
|
Fig. 3 Top: phase lag between the V- and the J-band light-curve of SMC Cepheids. The black open circles are estimated by adopting the epoch of maximum brightness as phase zero-point, while the orange dots by adopting the new phasing, i.e. the epoch of the mean-magnitude along the rising branch. The red lines show the linear fit of the orange data set. The rms (dashed lines) are also overplotted. The values of the medians and of the rms are labeled in the top of the panel. Middle: same as the top, but for the H band. Bottom: same as the top, but for the KS band. |
| In the text | |
|
Fig. 4 Merged light-curves (Tbin) for the J (left), H (middle) and KS bands (right) for the ten period bins of FU Cepheids (see Eq. (5) and the following text for more details). The range of periods in days is labeled in the top right corner of the left panel for each bin. The G3 (green line) and the F7 (red line) templates are also shown. |
| In the text | |
|
Fig. 5 Merged light-curve for FO Cepheids. The F3 (red line) and G2 (green line) templates are also shown. |
| In the text | |
|
Fig. 6 From left to right: residuals of the J-band merged light-curves (silver dots) obtained with the new templates: F7 (red line; top) and G3 (green line; bottom) for the period bin 4 (7−9.5 days), bin 6 (10.5−13.5 days) and bin 7 (13.5−15.5 days). The residuals attain vanishing mean values for the F7 and the G3 templates. |
| In the text | |
|
Fig. 7 Comparison between the merged light-curve |
| In the text | |
|
Fig. 8 From left to right: comparison between the normalized J-band light-curve (black dots) of U Aql and the S05 (blue line; left), F7 (red line; center) and the G3 (green line; right) templates. The typical error associated with observations (±0.01 mag) and rescaled in normalized units is about ~0.001 and is shown in the top left corner of the plot. The residuals between the data and the templates are plotted in the bottom panels. The dashed lines indicates the rms of the residuals; it decreases from 0.10 (S05) to 0.04 (F7, G3). |
| In the text | |
|
Fig. 9 Top left: amplitude ratios – AJ/AV – as a function of the period for LMC and MW calibrating Cepheids. The dashed vertical lines display the individual bins in period. The color coding is the same as in Fig. 1: orange dots for the P04 sample, red dots for the MP sample, and blue dots for the LS sample. The black solid lines are the mean amplitude ratios estimated on the selected period ranges: P ≤ 20 days and P> 20 days. The error bars in the top left corner show the typical photometric error. Top right: same as the left, but for SMC calibrating Cepheids (green dots). The comparison between the value of the mean ratio in the left and in right panels shows that amplitude ratios of SMC Cepheids are systematically lower than those of LMC+MW Cepheids. Middle: same as the top, but for the AH/AV amplitude ratios. Bottom: same as the top, but for the AKs/AV amplitude ratios. Note that the period ranges for this band are P ≤ 15.5 days and P> 15.5 days. |
| In the text | |
|
Fig. 10 Top: phase lags in J band for FO Cepheids based on the epoch of the maximum (black circles) and on the epoch of the mean magnitude along the rising branch (orange dots). The median (solid lines) and rms (dashed lines) of the ten calibrating Cepheids are overplotted. The black labels refer to the epoch of maximum, orange labels to the epoch of the mean magnitude. Bottom: the amplitude ratio A(J) /A(V) for FO Cepheids. The mean values for the two adopted bins in period (P ≤ 2.8, and P> 2.8 days) are also labeled (black solid lines). |
| In the text | |
|
Fig. 11 Top: δJ for period bin 3 (5–7 days) by adopting the F7 (red dots, left panel), the G3 (green dots, central panel), and the S05 templates (blue dots, right panel). The gray dots on the background are the difference between the mean magnitude estimated by applying the templates and the true mean magnitude estimate by the individual fits. By binning the phase in ten different bins, we estimated the mean of the residuals (dots) and the standard deviation (error bar). The solid black lines show the mean values, which are <10-3 mag for the three templates. Bottom: same as top, but for period bin 4 (7−9.5 days). |
| In the text | |
|
Fig. 12 Same as Fig. 11, but for FO calibrating Cepheids. The δJ are based on the F7 (top) and the G2 (bottom) templates. The red (F3) and green (G2) dots indicate the mean for each of the 20 bins in phase and the standard deviation (error bars). The mean of the residuals is ≤ 0.01, with a mean rms of 0.04 mag. |
| In the text | |
|
Fig. 13 Random-phase extraction test for all the period bins in the different NIR bands (from top to bottom: J, H and KS) in the SMC sample. The red triangles show the difference between the mean magnitude predicted by applying the F7 template to the single-epoch NIR observation (left panel). In the middle panel the green triangles were evaluated by applying the G3 template, while the blue triangles in the left panel are evaluated by applying the S05 template. The shadowed areas shows the 2σ of the results (F7: light red; G3: light green; S05: light blue), while the black lines indicate the zero. The residuals of F7 and G3 template show no dependence on the phase, and the dispersion is from ~20% (KS) to 40%(J) lower than the residuals of the S05 template. |
| In the text | |
|
Fig. 14 Same as Fig. 13, but for Galactic Cepheids (LS, MP). The red triangles show the difference between the mean magnitude predicted by applying the F7 template (left panel), the G3 template (central panel, green triangles), and the S05 template (right panel, blue triangles). The shadowed areas shows the 2σ of the results (F7: light red; G3: light green; S05: light blue), while the black lines indicate the zero for each data set. |
| In the text | |
|
Fig. 15 Random-phase extraction for FO calibrating Cepheids in the J-band. The red triangles show the differences between the mean magnitude based on the F3 template and on single-epoch NIR observations (top panel). The middle panel shows the residuals (green triangles) based on the G2 template, while the bottom panel shows the residuals (black triangles) of the single-epoch measurements. The shadowed areas shows the 2σ of the results (F7: light red; G2: light green; single-epoch: light gray), while the black lines display the mean. |
| In the text | |
|
Fig. 16 Top: from left to right: histogram of the difference between the true mean Wesenheit W(JKS) and the mean Wesenheit magnitude estimated by using the F7, G3, S05 templates, and the single-epoch data. The single-epoch data were randomly extracted from the calibrating SMC light-curve at different phases for the J, H, and the KS bands. The Gaussian fits from which the labeled standard deviation has been estimated are also overplotted on the histograms. Middle: same as top, but for the W(HKS) magnitude. Bottom: same as top, but for the W(JH) magnitude. |
| In the text | |
Current usage metrics show cumulative count of Article Views (full-text article views including HTML views, PDF and ePub downloads, according to the available data) and Abstracts Views on Vision4Press platform.
Data correspond to usage on the plateform after 2015. The current usage metrics is available 48-96 hours after online publication and is updated daily on week days.
Initial download of the metrics may take a while.