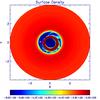
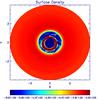
Fig. 7

Log Σ contours for q = 0.02 with softening length 0.1H after 50 orbits (left panel) and after 100 orbits (right panel). In these simulations the companion, its position in each case being at the centre of the small red circle located within the gap region, was allowed to accrete. The widths of the gaps slowly increase, while the accretion rates, on average, decrease slowly with time. Short wavelength density waves in the outer disks are just visible. Values of log Σ below the minimum indicated on the colour bar are plotted as that minimum value.
Current usage metrics show cumulative count of Article Views (full-text article views including HTML views, PDF and ePub downloads, according to the available data) and Abstracts Views on Vision4Press platform.
Data correspond to usage on the plateform after 2015. The current usage metrics is available 48-96 hours after online publication and is updated daily on week days.
Initial download of the metrics may take a while.