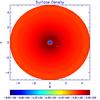
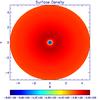
Fig. 2

log Σ contours for q = 0.001 with softening length 0.6H after 100 orbits (left panel) and after 840 orbits (right panel). In these simulations, the companion was not allowed to accrete: its position in each case is at the centre of the small superposed red circle, located on the line at an angle of ~315° to the x axis (left panel) and at an angle of ~45° to the x axis (right panel). Short wavelength density waves are visible on both sides of the quasi-circular orbit. The relative density changes are similar in both these plots. However, the density in the interior regions of the disk decreases at later times on account of accretion through the inner boundary as is manifest in both panels.
Current usage metrics show cumulative count of Article Views (full-text article views including HTML views, PDF and ePub downloads, according to the available data) and Abstracts Views on Vision4Press platform.
Data correspond to usage on the plateform after 2015. The current usage metrics is available 48-96 hours after online publication and is updated daily on week days.
Initial download of the metrics may take a while.