Fig. 9
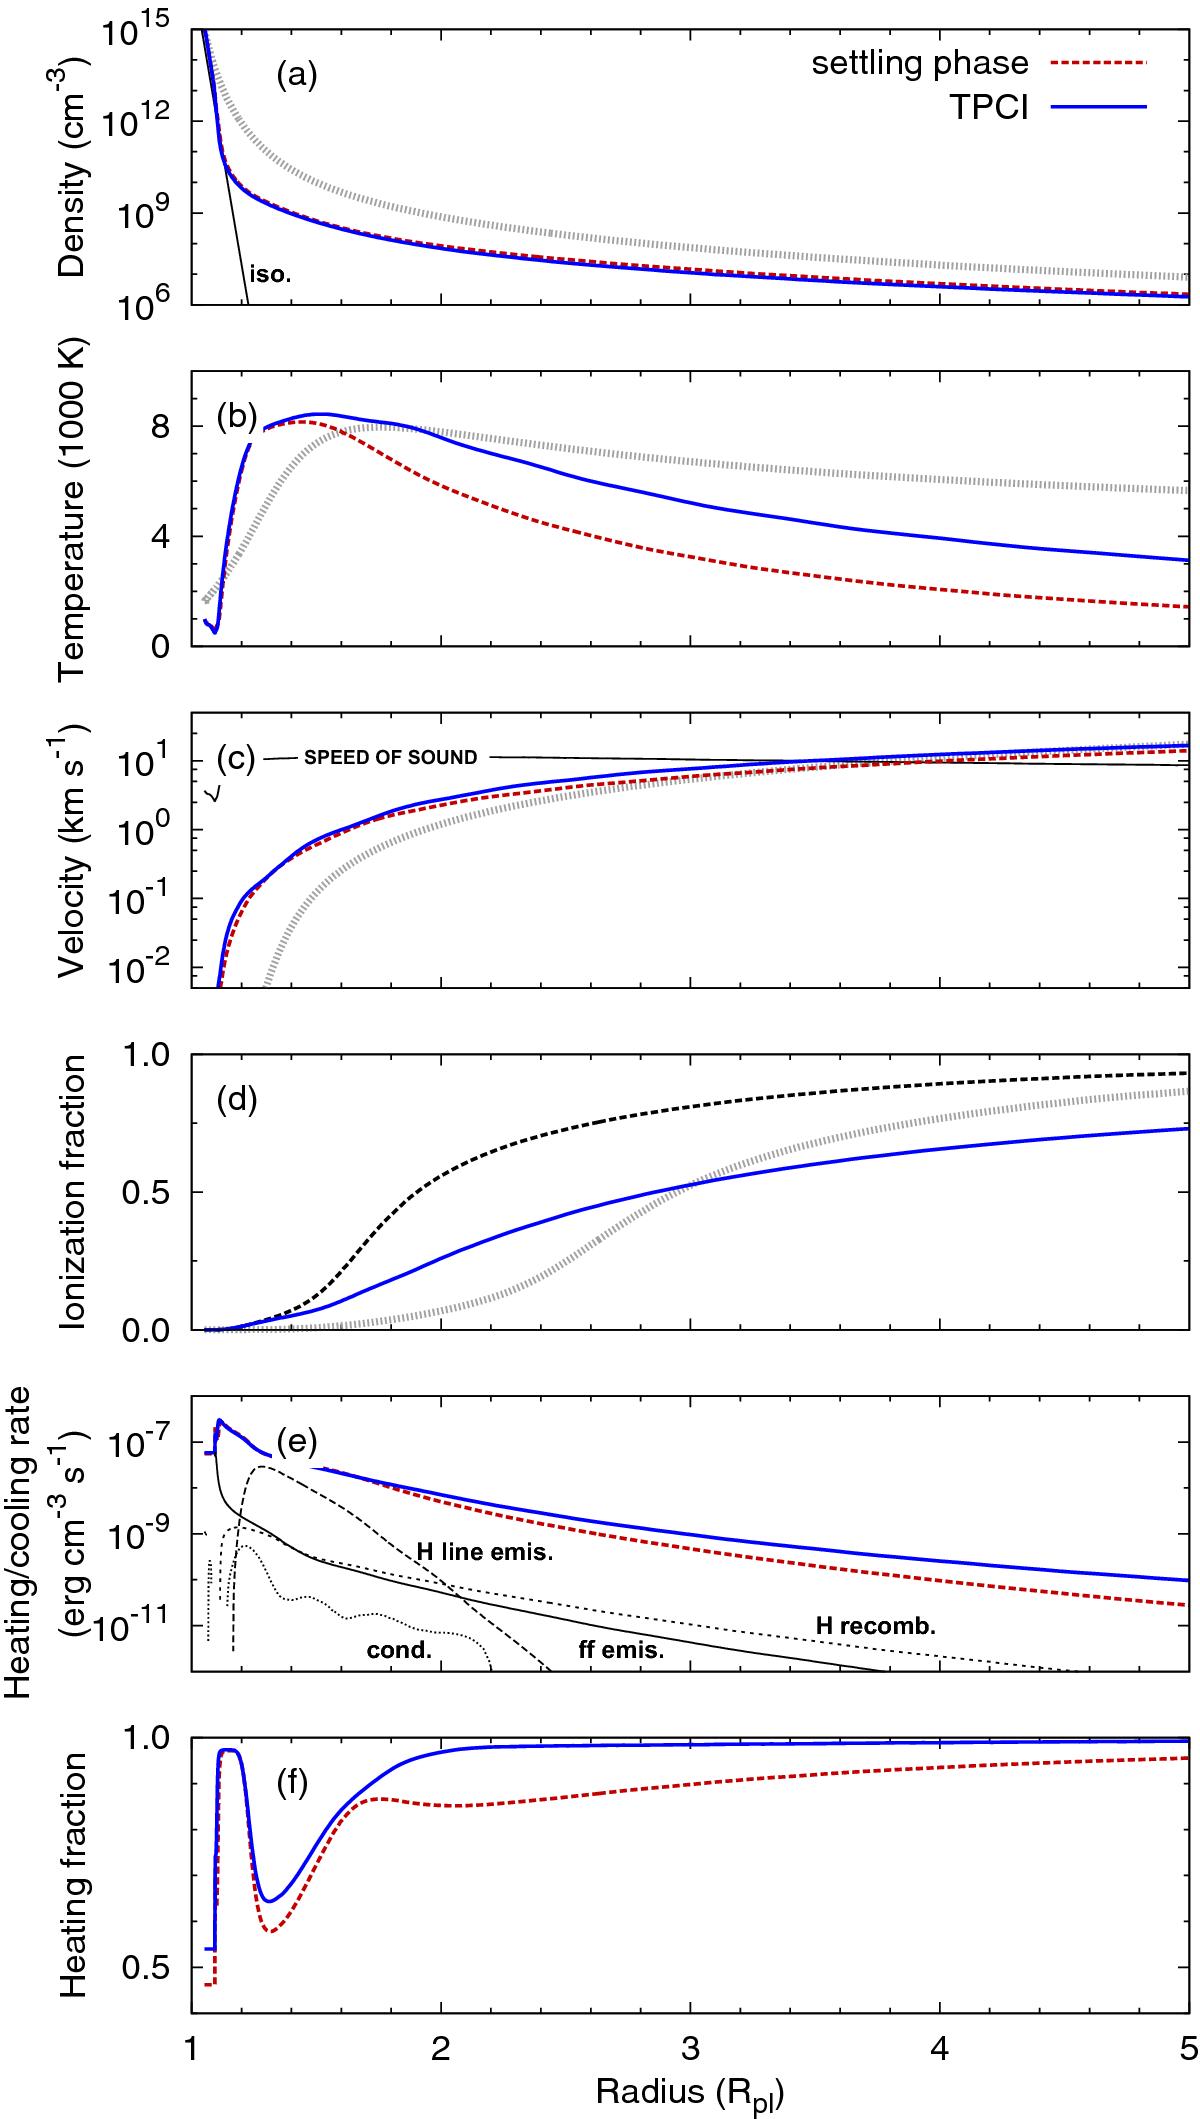
Evaporating hydrogen atmosphere of HD 209458 b. Density a), temperature b), velocity c), ionization fraction d), heating and cooling rate e), and the heating fraction f) are plotted versus the planetary radius. The red dashed lines depict the initial settling phase, the blue solid lines the final TPCI simulation including advection of species. The initial conditions are given by the gray dotted lines. Panel a) also shows the density structure of an isothermal atmosphere with 500 K (black solid line). In panel c) the speed of sound is indicated (black solid line), and in panel e) the three main cooling agents in the atmosphere are shown by black thin lines. “H line emis.” is cooling due to line emission from hydrogen atoms (mainly Lyα), “ff emis.” is cooling by free-free emission of electrons, and “H recomb.” is recombination cooling of hydrogen. Additionally, thermal conductive cooling (cond.) is shown by a black dotted line. The atmosphere expands in a transonic flow. A small amount of the absorbed energy (~11%) is lost through free-free and Lyα emission.
Current usage metrics show cumulative count of Article Views (full-text article views including HTML views, PDF and ePub downloads, according to the available data) and Abstracts Views on Vision4Press platform.
Data correspond to usage on the plateform after 2015. The current usage metrics is available 48-96 hours after online publication and is updated daily on week days.
Initial download of the metrics may take a while.