Fig. 8
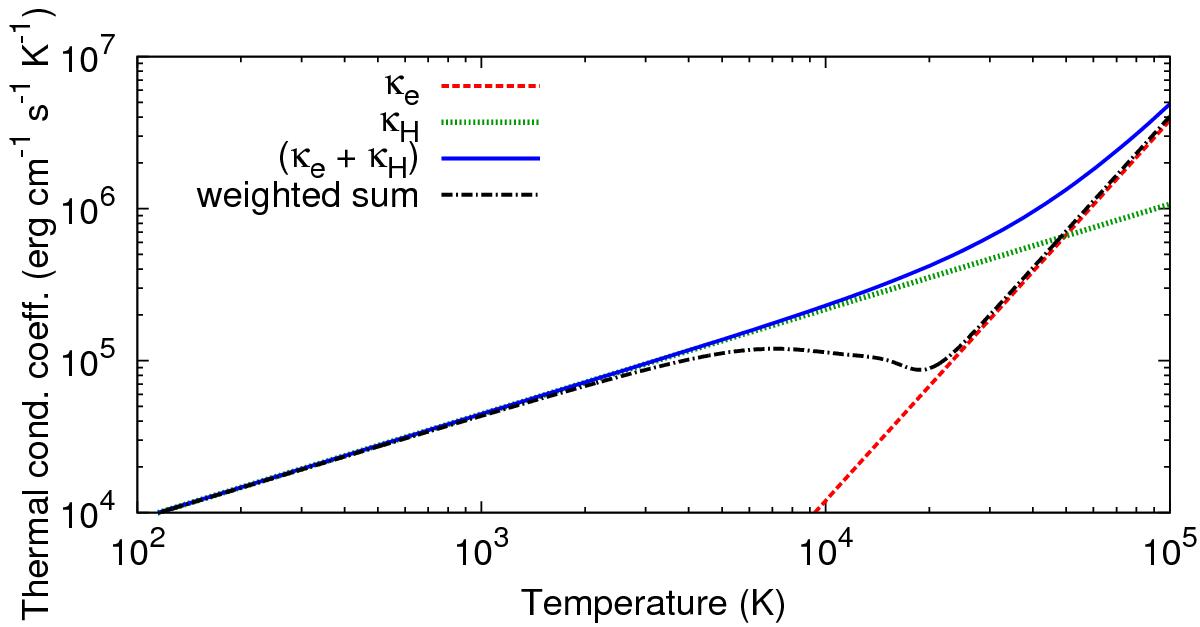
Thermal conductivity coefficient. The coefficient for electron conductivity is depicted by the red dashed line, for neutral hydrogen by the green dotted line, and the blue solid line is the sum. The black dash-dotted line shows the more accurate weighted sum (Eq. (26)) derived with the actual densities of neutral hydrogen and electrons in a CLOUDY simulation without irradiation. In the temperature region below 10 000 K the simple sum is accurate to within a factor of two.
Current usage metrics show cumulative count of Article Views (full-text article views including HTML views, PDF and ePub downloads, according to the available data) and Abstracts Views on Vision4Press platform.
Data correspond to usage on the plateform after 2015. The current usage metrics is available 48-96 hours after online publication and is updated daily on week days.
Initial download of the metrics may take a while.