Fig. 7
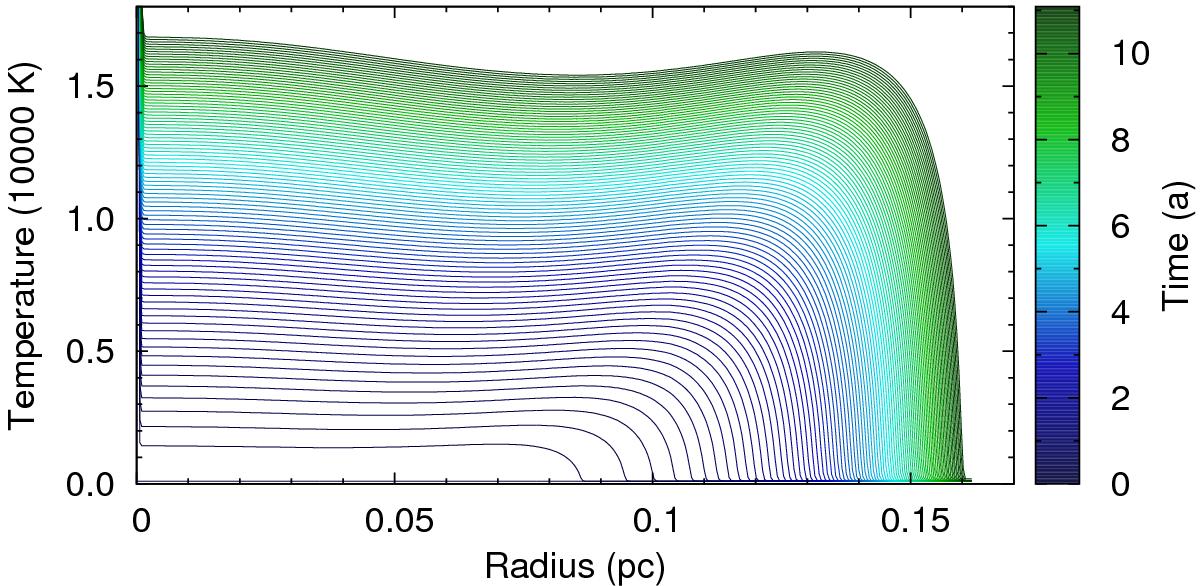
Temperature evolution during expansion of the R-type ionization front. The temperature versus radius is plotted at various times. The time step between consecutive lines is constant, the time is referenced by the color scheme. The temperature increases from 1000 K to 17 000 K, being nearly constant throughout the ionized region. The expansion radius of the ionized region at a given time is marked by the steep temperature decline and increases from 0.085 to 0.16 pc. The distance between consecutive lines decreases, indicating the approach to the final Strömgren radius.
Current usage metrics show cumulative count of Article Views (full-text article views including HTML views, PDF and ePub downloads, according to the available data) and Abstracts Views on Vision4Press platform.
Data correspond to usage on the plateform after 2015. The current usage metrics is available 48-96 hours after online publication and is updated daily on week days.
Initial download of the metrics may take a while.