Fig. 5
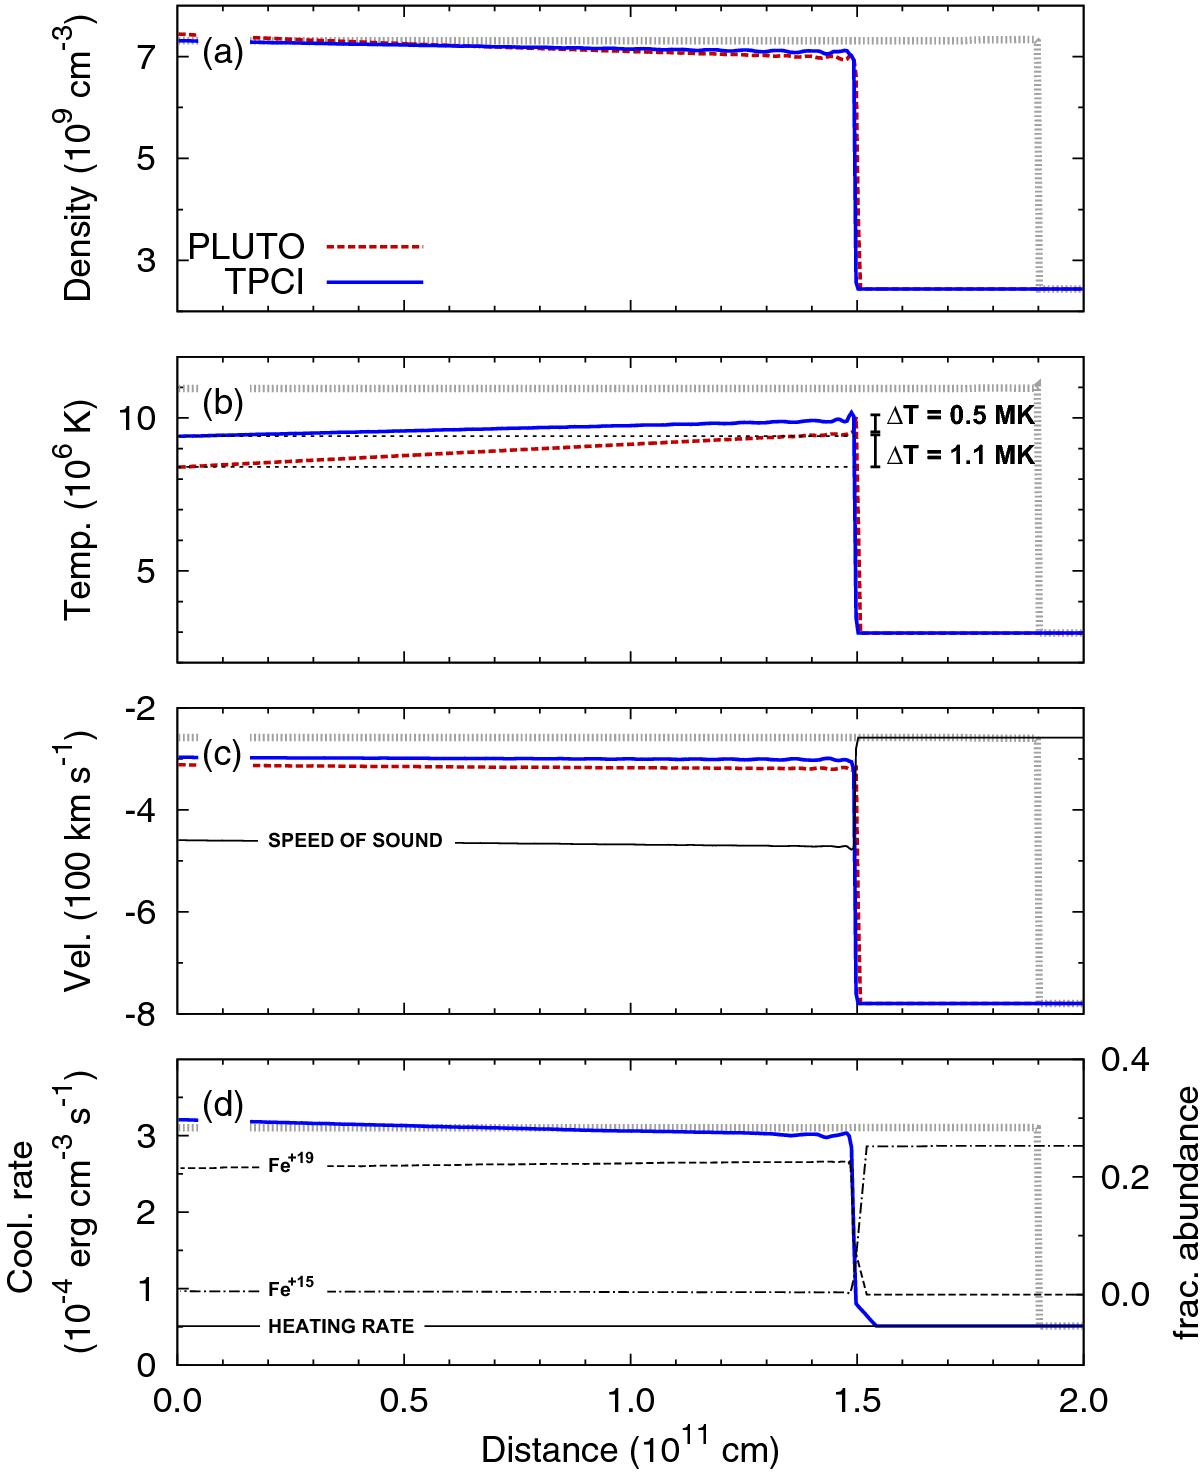
Hydrodynamic evaporation wave in a flaring coronal loop. The red dashed lines show a simulation with PLUTO assuming optically thin cooling. The blue lines depict the results of TPCI, and the initial conditions are given by the gray dotted lines. The density is shown in panel a), the temperature in b), the velocity in c), and the cooling of TPCI is plotted in panel d) together with the constant heating rate. Panel d) shows the fractional abundance of the two iron ions with the strongest individual contribution to the total cooling rate. In panel b) the temperature decrement in the after-shock evolution is indicated. The sound speed is shown by the solid black line in panel c). Both simulations show the same behavior, except that in the PLUTO simulation the cooling rate is twice as strong as in the TPCI simulation, which is due to optical-depth effects and small differences of the electron density.
Current usage metrics show cumulative count of Article Views (full-text article views including HTML views, PDF and ePub downloads, according to the available data) and Abstracts Views on Vision4Press platform.
Data correspond to usage on the plateform after 2015. The current usage metrics is available 48-96 hours after online publication and is updated daily on week days.
Initial download of the metrics may take a while.