Fig. 3
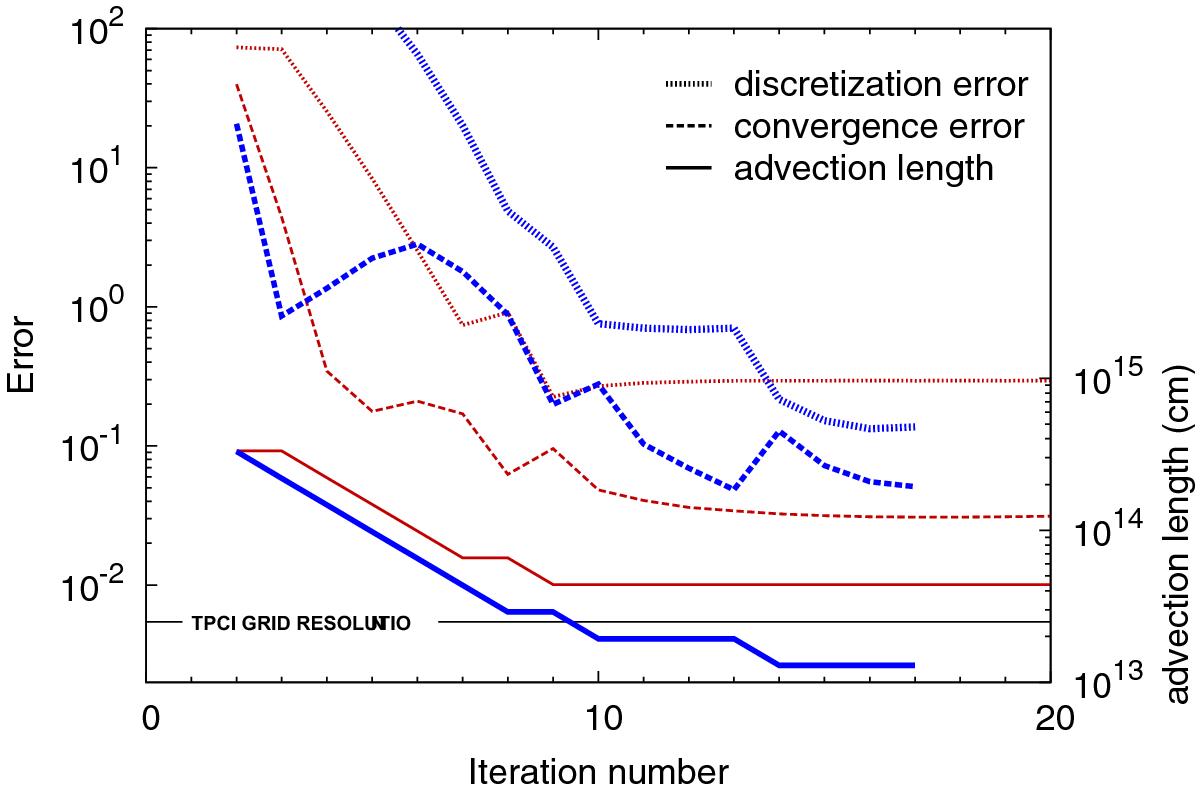
Convergence of the models of the weak D-type ionization front. The CLOUDY simulation is shown by red, thin lines, the advective TPCI simulation by thick, blue lines. The discretization error (dotted), the convergence error (dashed), and the advection length (solid) are plotted against the iteration number of the steady-state solver in CLOUDY. The grid resolution of the TPCI simulation is indicated by the thin, black line. In both simulations the advection length is reduced to within a factor of 2 of the grid resolution in the hydrodynamic simulation part.
Current usage metrics show cumulative count of Article Views (full-text article views including HTML views, PDF and ePub downloads, according to the available data) and Abstracts Views on Vision4Press platform.
Data correspond to usage on the plateform after 2015. The current usage metrics is available 48-96 hours after online publication and is updated daily on week days.
Initial download of the metrics may take a while.