Fig. 2
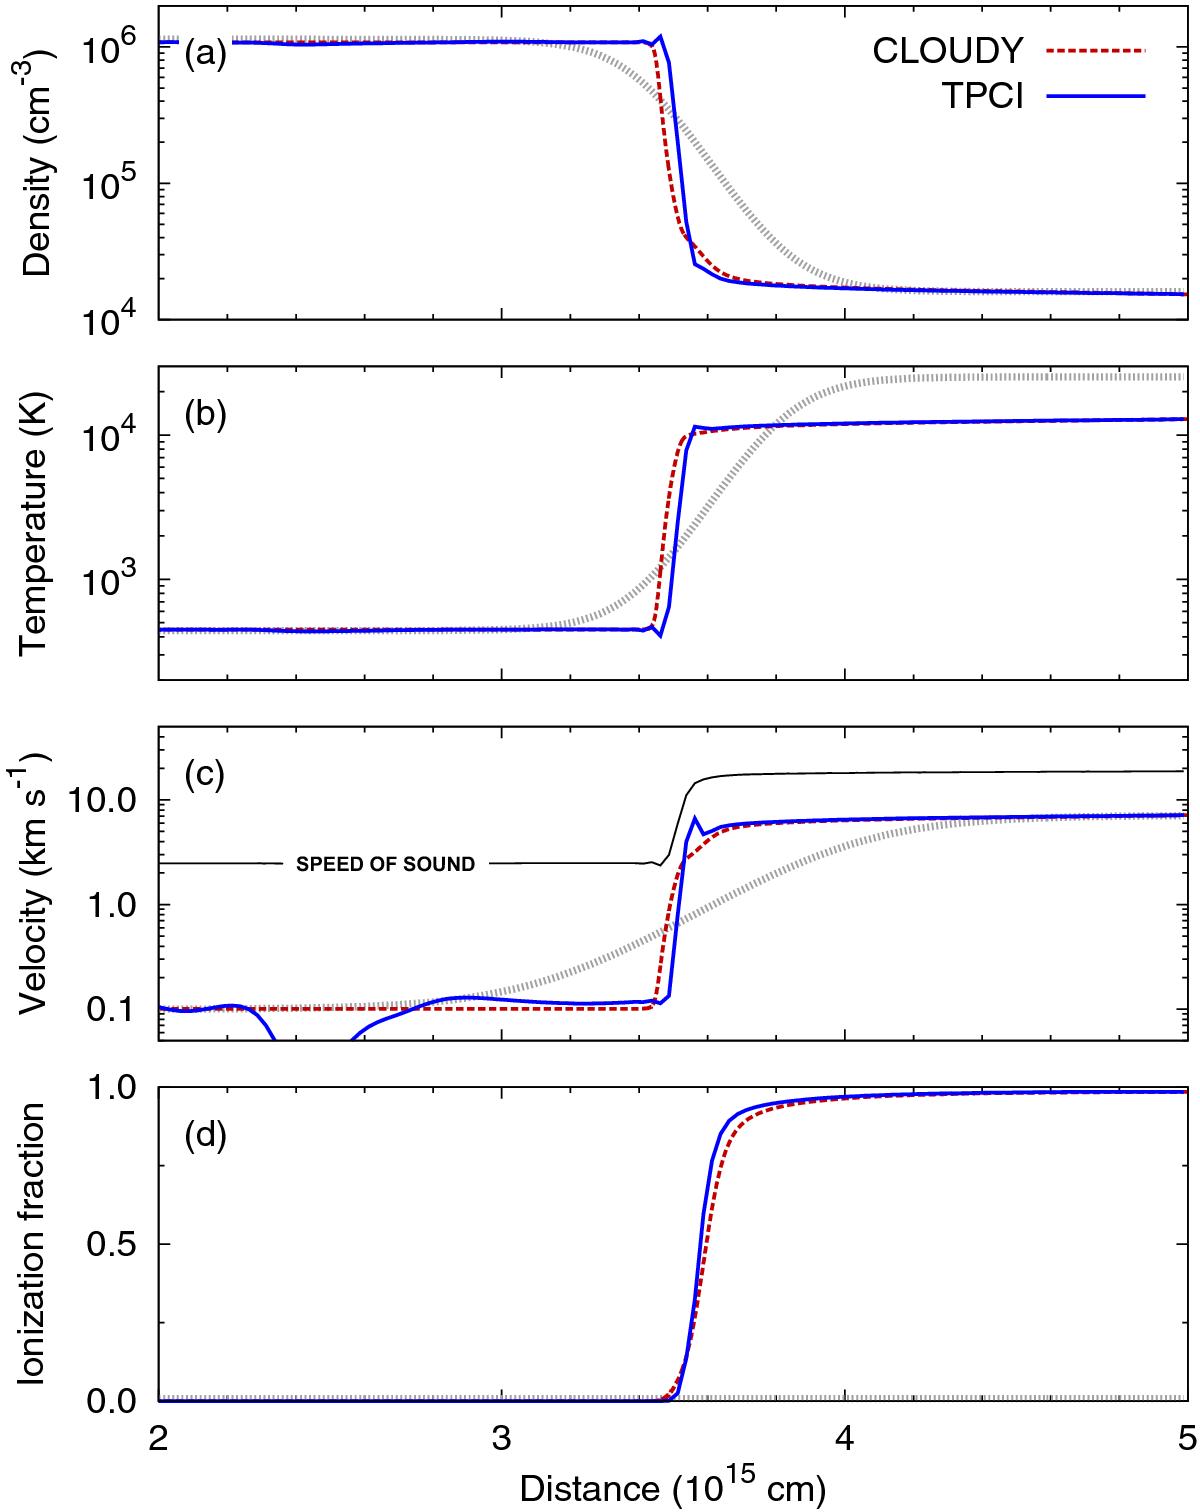
Pure hydrogen weak D-type ionization front. Density a), temperature b), velocity c), and degree of ionization d) are depicted. A CLOUDY simulation (red dashed lines) is compared with a TPCI simulation (blue solid lines). Initial conditions are given by the gray dotted lines. In panel c) the speed of sound is shown by the black solid line. The TPCI simulation agrees well with the independent CLOUDY simulation. Small oscillations in the high-density region that can be seen in panel c) do not affect the solution significantly.
Current usage metrics show cumulative count of Article Views (full-text article views including HTML views, PDF and ePub downloads, according to the available data) and Abstracts Views on Vision4Press platform.
Data correspond to usage on the plateform after 2015. The current usage metrics is available 48-96 hours after online publication and is updated daily on week days.
Initial download of the metrics may take a while.