Fig. 7
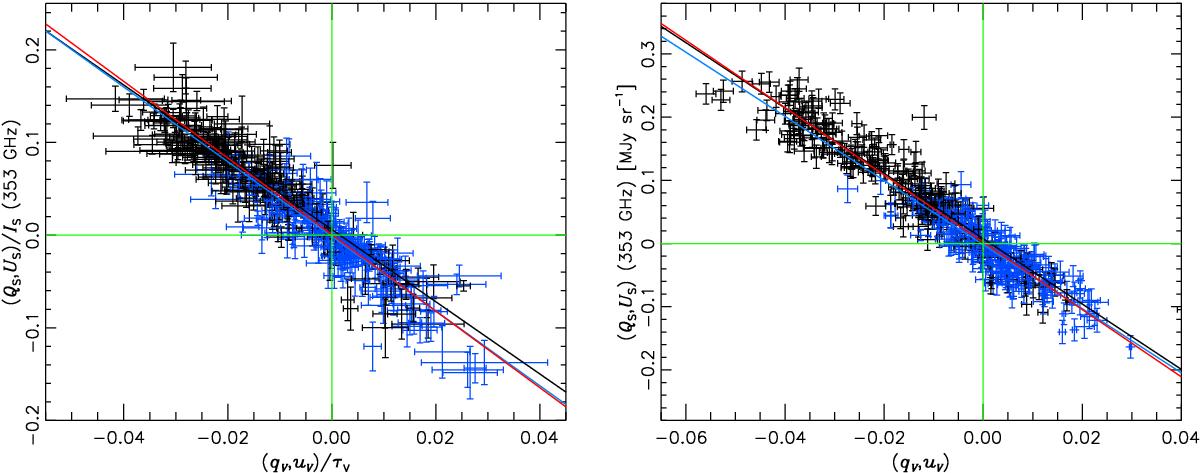
Left: correlation of polarization fractions in emission with those in extinction for the joint fit in Q (black) and U (blue). Using Eq. (15) the best linear fit (red line) has slope and y-intercept − 4.13 ± 0.06 and 0.0006 ± 0.0007, respectively. The Pearson correlation coefficient is − 0.93 and ![]() . Right: correlation of polarized intensity in emission (MJy sr-1) with the degree of interstellar polarization. Using Eq. (16), the best linear fit (red line) has slope and y-intercept (− 5.32 ± 0.06) MJy sr-1 and (0.0020 ± 0.0009) MJy sr-1, respectively. The Pearson correlation coefficient is − 0.95 and
. Right: correlation of polarized intensity in emission (MJy sr-1) with the degree of interstellar polarization. Using Eq. (16), the best linear fit (red line) has slope and y-intercept (− 5.32 ± 0.06) MJy sr-1 and (0.0020 ± 0.0009) MJy sr-1, respectively. The Pearson correlation coefficient is − 0.95 and ![]() . Lines for the independent fits to Q (black) and U (blue) are also shown.
. Lines for the independent fits to Q (black) and U (blue) are also shown.
Current usage metrics show cumulative count of Article Views (full-text article views including HTML views, PDF and ePub downloads, according to the available data) and Abstracts Views on Vision4Press platform.
Data correspond to usage on the plateform after 2015. The current usage metrics is available 48-96 hours after online publication and is updated daily on week days.
Initial download of the metrics may take a while.