Fig. 6
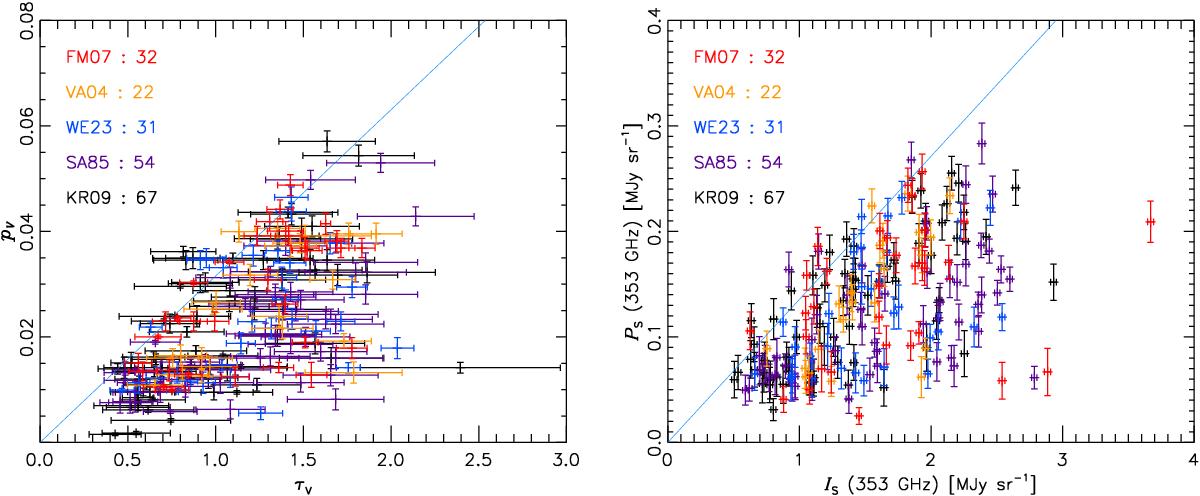
Scatterplots of data for the selected lines of sight (Left: extinction; Right: submillimetre emission). Polarization degree pV and intensity PS were debiased with the Modified Asymptotic method (Plaszczynski et al. 2014). We note the variable that has the larger error in each plot: in the visible, τV (x axis); in the submillimetre, PS (y axis). In the left panel, the line (blue) represents the “classical” upper envelope, pV = 0.0315 τV (Serkowski et al. 1975). This upper envelope has been transferred to the right panel using the derived value for RS /V.
Current usage metrics show cumulative count of Article Views (full-text article views including HTML views, PDF and ePub downloads, according to the available data) and Abstracts Views on Vision4Press platform.
Data correspond to usage on the plateform after 2015. The current usage metrics is available 48-96 hours after online publication and is updated daily on week days.
Initial download of the metrics may take a while.