Fig. 4
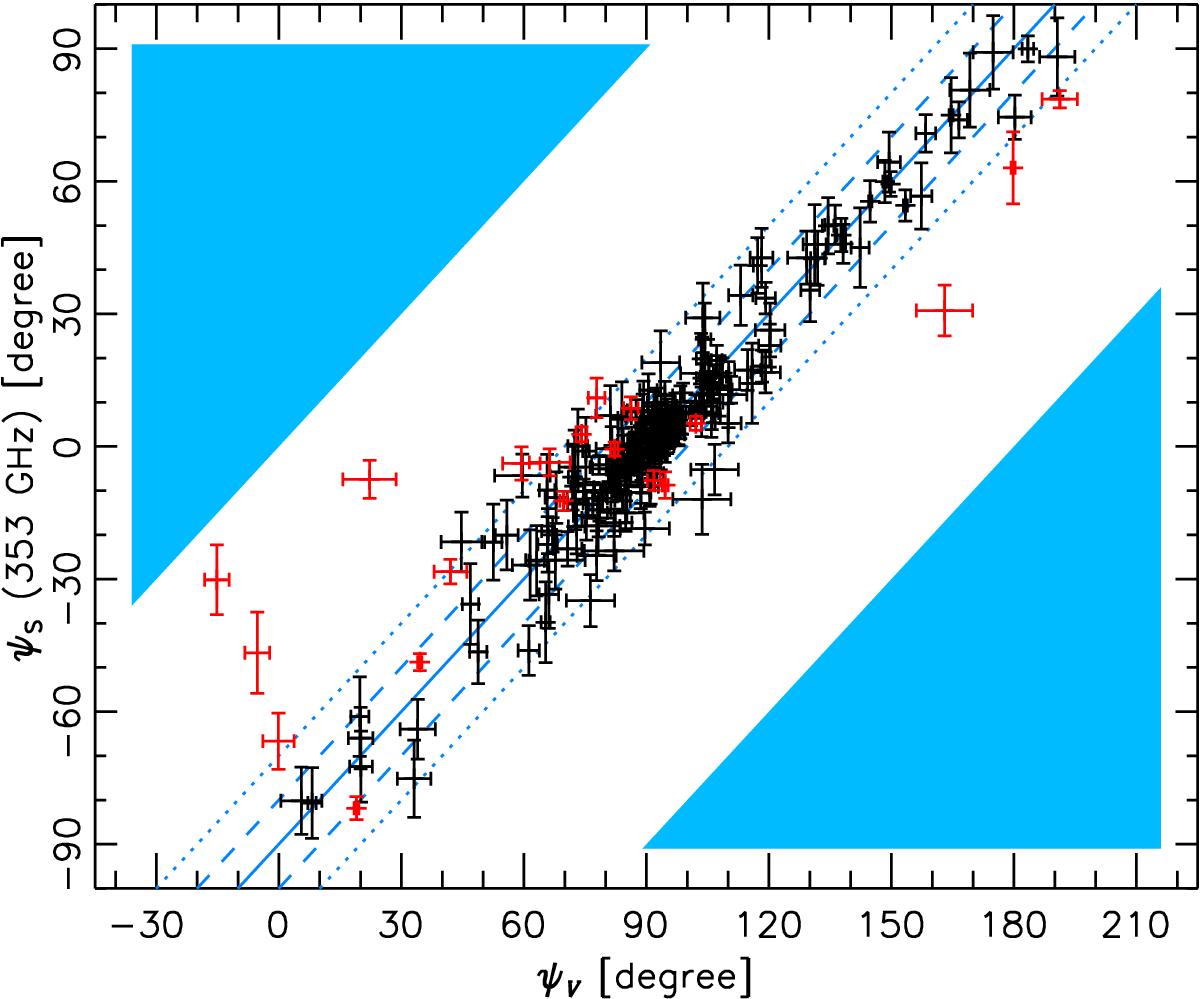
Correlation plot of position angles in emission, ψS, and in extinction, ψV, for the merged sample, for lines of sight satisfying the first three selection criteria. Data for lines of sight failing the fourth angle criterion are marked in red; those finally selected are in black. The central diagonal solid line indicates perfect agreement (orthogonal polarization pseudo-vectors), and other lines are for offsets of 10° (dashed) and 20° (dotted). We note that when the arithmetic difference in angles falls outside the allowed ± 90° range for ψS (filled zones), the plotted ψV is adjusted by ± 180° (Eq. (9)).
Current usage metrics show cumulative count of Article Views (full-text article views including HTML views, PDF and ePub downloads, according to the available data) and Abstracts Views on Vision4Press platform.
Data correspond to usage on the plateform after 2015. The current usage metrics is available 48-96 hours after online publication and is updated daily on week days.
Initial download of the metrics may take a while.