Fig. 3
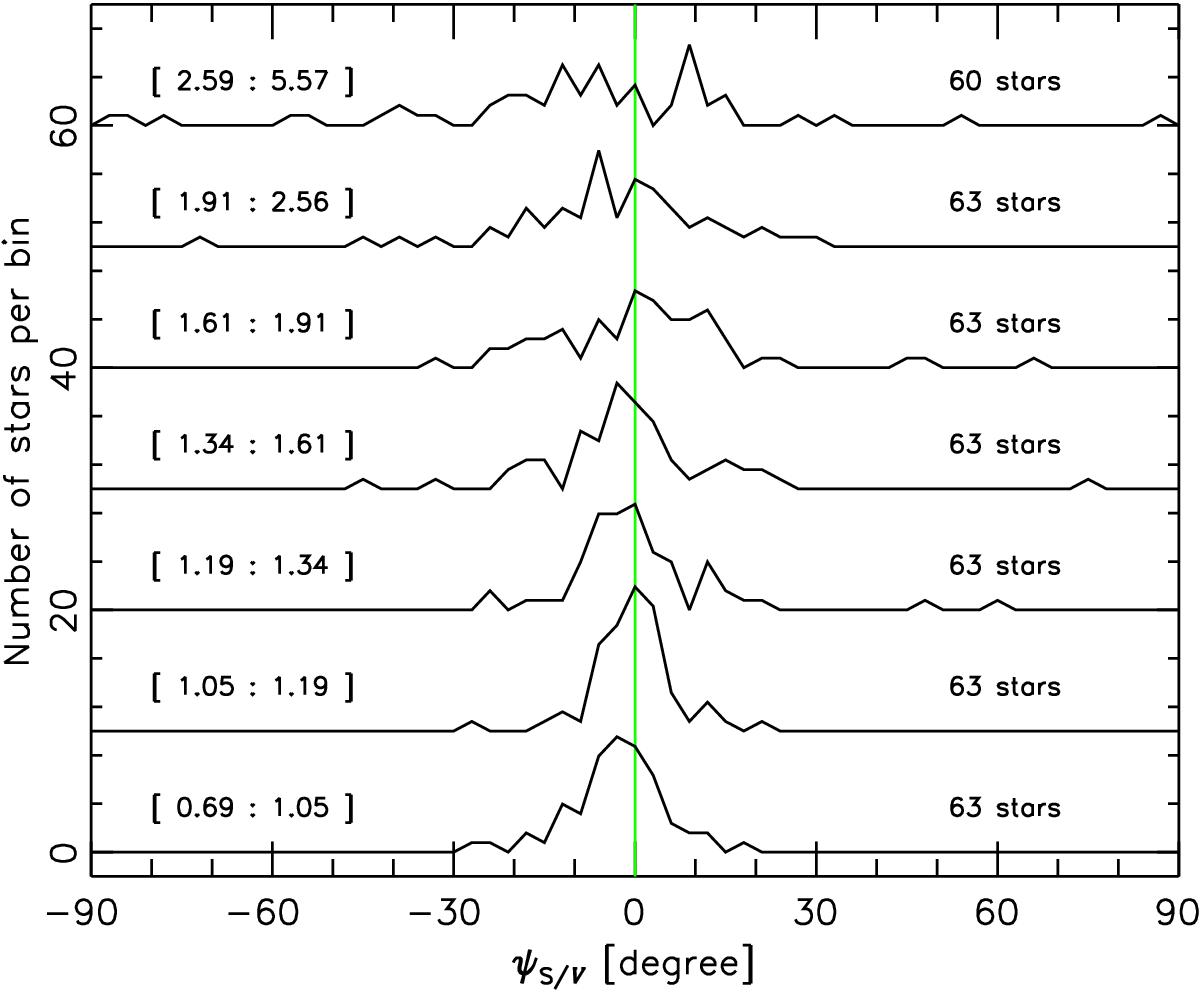
Histograms of difference in position angles ψS /V for successive ranges in column density ratio, RτS, as indicated on the left, with the corresponding number of stars on the right. Only lines of sight of our five samples satisfying the first (S/N) and second (diffuse ISM) selection criteria have been used. For clarity, the histogram has been shifted upward by 10 units for each range.
Current usage metrics show cumulative count of Article Views (full-text article views including HTML views, PDF and ePub downloads, according to the available data) and Abstracts Views on Vision4Press platform.
Data correspond to usage on the plateform after 2015. The current usage metrics is available 48-96 hours after online publication and is updated daily on week days.
Initial download of the metrics may take a while.