Fig. C.2
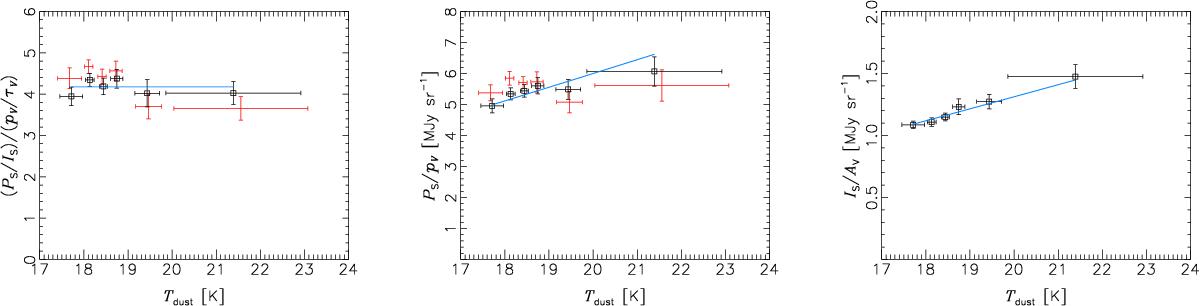
Left: mean RS /V as a function of the mean Tdust, each plotted with the standard deviation, in bins of equal number. Two versions of the Planck data have been used: with (black) and without (red) correction for leakage of intensity into polarization. Middle: the same, but for RP/p. Right: the same, but for IS/AV. The blue curves, motivated in the right panel, show the expected response of the ratios to an increase in Tdust, according to a simple model in which the subset of grains that are polarizing had the same temperature as characterized the total emission (see text).
Current usage metrics show cumulative count of Article Views (full-text article views including HTML views, PDF and ePub downloads, according to the available data) and Abstracts Views on Vision4Press platform.
Data correspond to usage on the plateform after 2015. The current usage metrics is available 48-96 hours after online publication and is updated daily on week days.
Initial download of the metrics may take a while.