Fig. 7
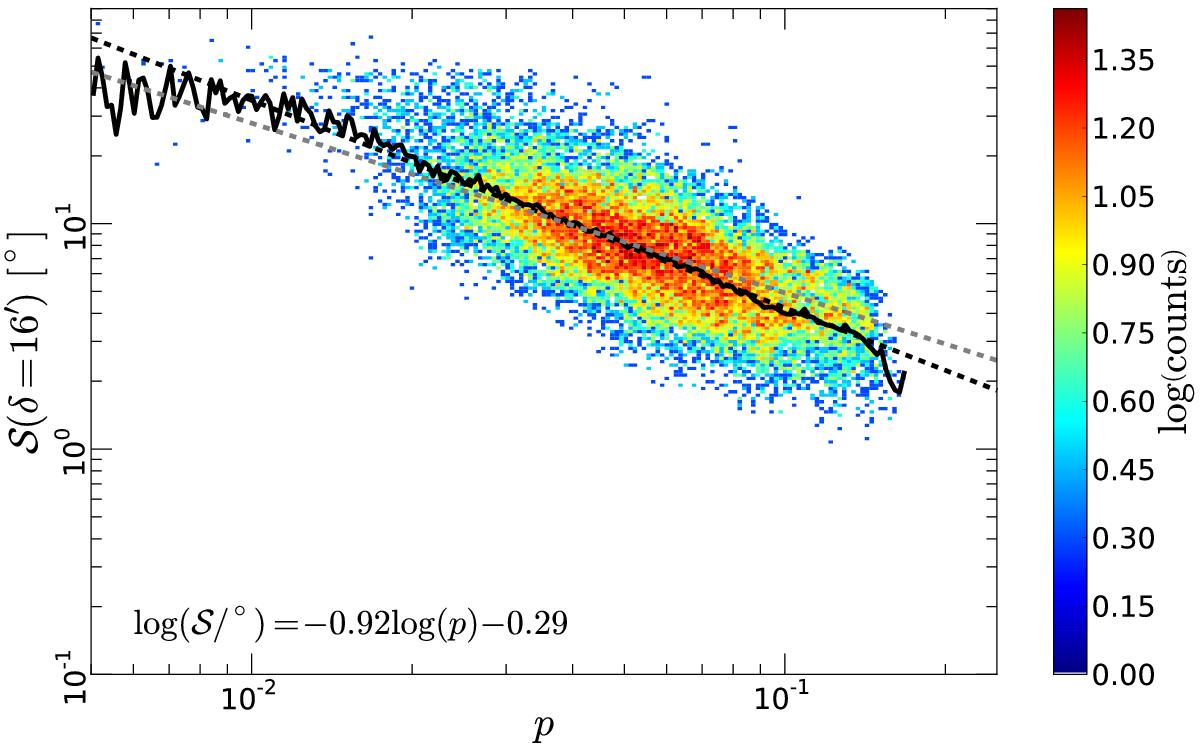
Two-dimensional distribution function of ![]() and polarization fraction p for the Ophiuchus field. The angle
dispersion function
and polarization fraction p for the Ophiuchus field. The angle
dispersion function ![]() is computed at a lag δ =
16′. Only pixels for which p/σp>
3 are retained. The dashed grey line is the large-scale fit (with
FWHM =
1° and
is computed at a lag δ =
16′. Only pixels for which p/σp>
3 are retained. The dashed grey line is the large-scale fit (with
FWHM =
1° and ![]() )
)
![]() , the solid black line shows
the mean
, the solid black line shows
the mean ![]() for each bin in p (the bin size is Δlog (p) = 0.008) and
the dashed black line is a linear fit of that curve in log-log space, restricted to
bins in p which contain at least 1% of the total number
of points (so about 150 points per bin).
for each bin in p (the bin size is Δlog (p) = 0.008) and
the dashed black line is a linear fit of that curve in log-log space, restricted to
bins in p which contain at least 1% of the total number
of points (so about 150 points per bin).
Current usage metrics show cumulative count of Article Views (full-text article views including HTML views, PDF and ePub downloads, according to the available data) and Abstracts Views on Vision4Press platform.
Data correspond to usage on the plateform after 2015. The current usage metrics is available 48-96 hours after online publication and is updated daily on week days.
Initial download of the metrics may take a while.