Fig. 4
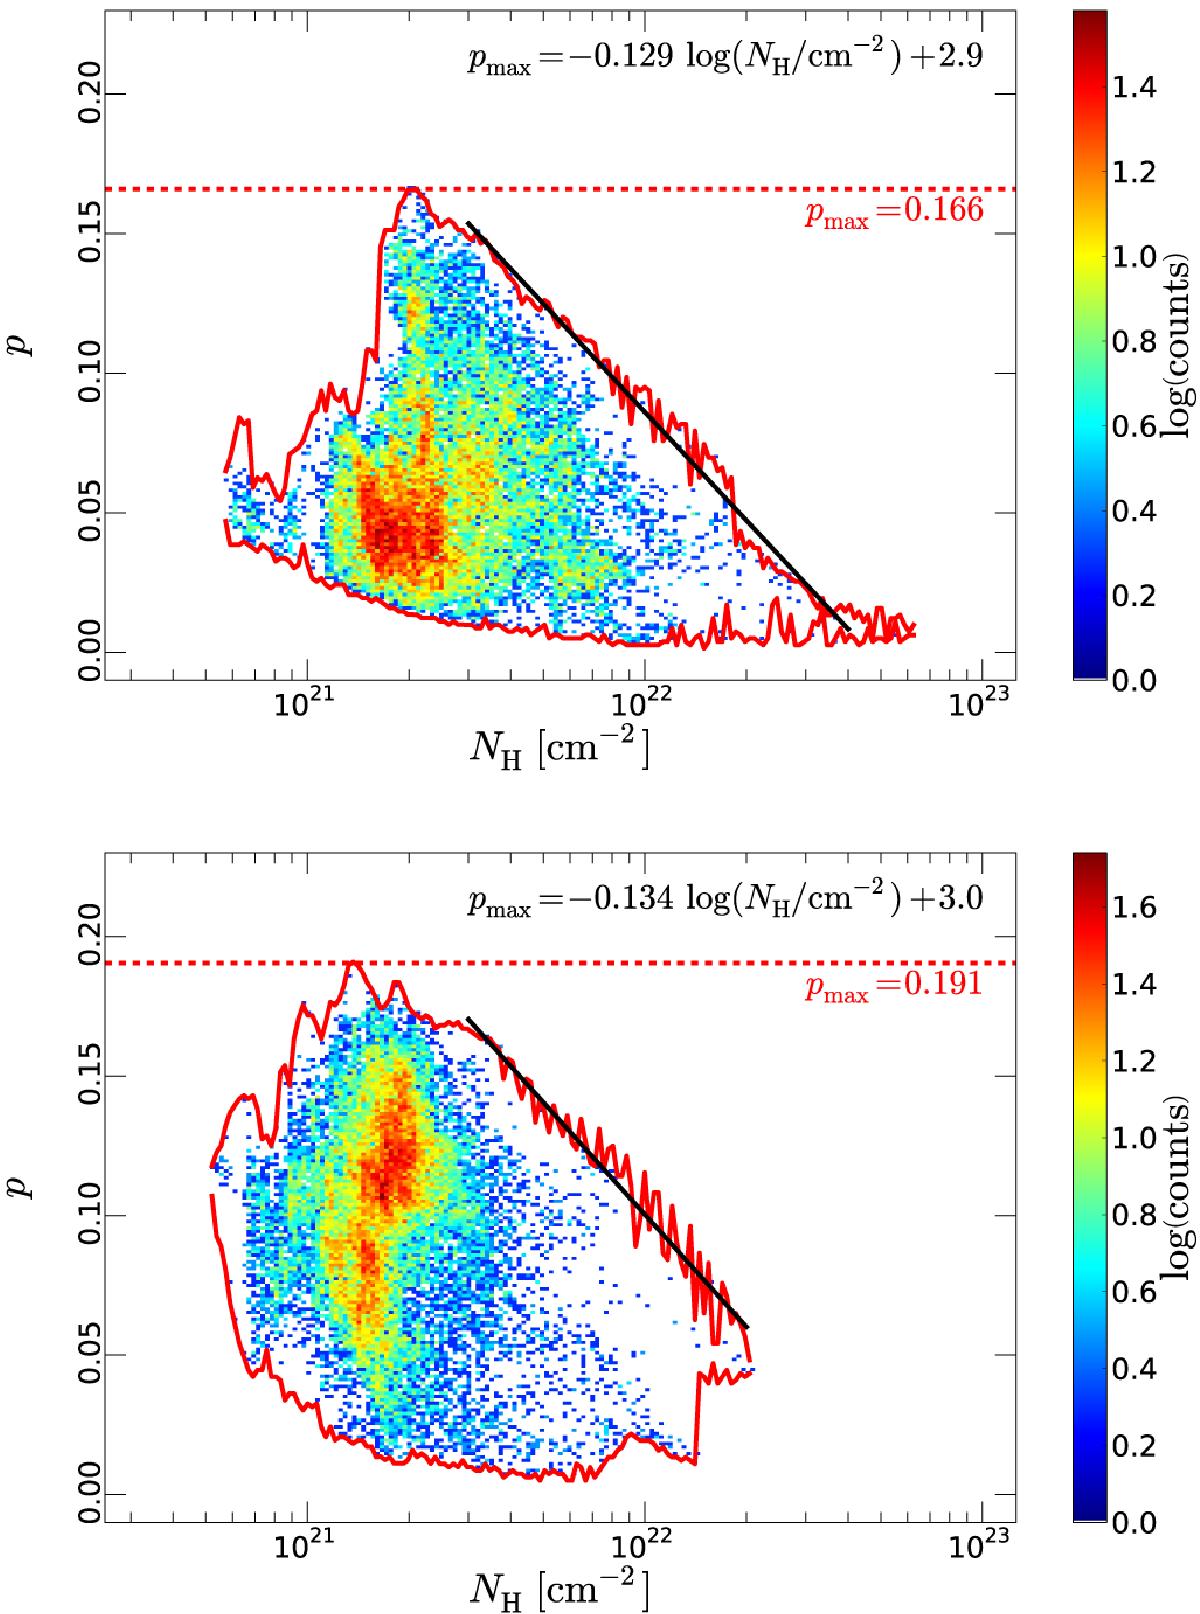
Two-dimensional distribution function of polarization fraction p and column density
NH. Top: Ophiuchus
field. Bottom: Chamaeleon-Musca field. The distribution functions
are presented in logarithmic colour scale and include only points for which
p/σp>
3. The dashed red lines correspond to the absolute maximum
polarization fractions pmax and the solid red curves show
the upper and lower envelopes of p as functions of NH. The
solid black line is a linear fit ![]() to the decrease of the maximum
polarization fraction with column density at the high end of NH (see
Table 2 for the fitting ranges and fit
parameters).
to the decrease of the maximum
polarization fraction with column density at the high end of NH (see
Table 2 for the fitting ranges and fit
parameters).
Current usage metrics show cumulative count of Article Views (full-text article views including HTML views, PDF and ePub downloads, according to the available data) and Abstracts Views on Vision4Press platform.
Data correspond to usage on the plateform after 2015. The current usage metrics is available 48-96 hours after online publication and is updated daily on week days.
Initial download of the metrics may take a while.