Fig. A.1
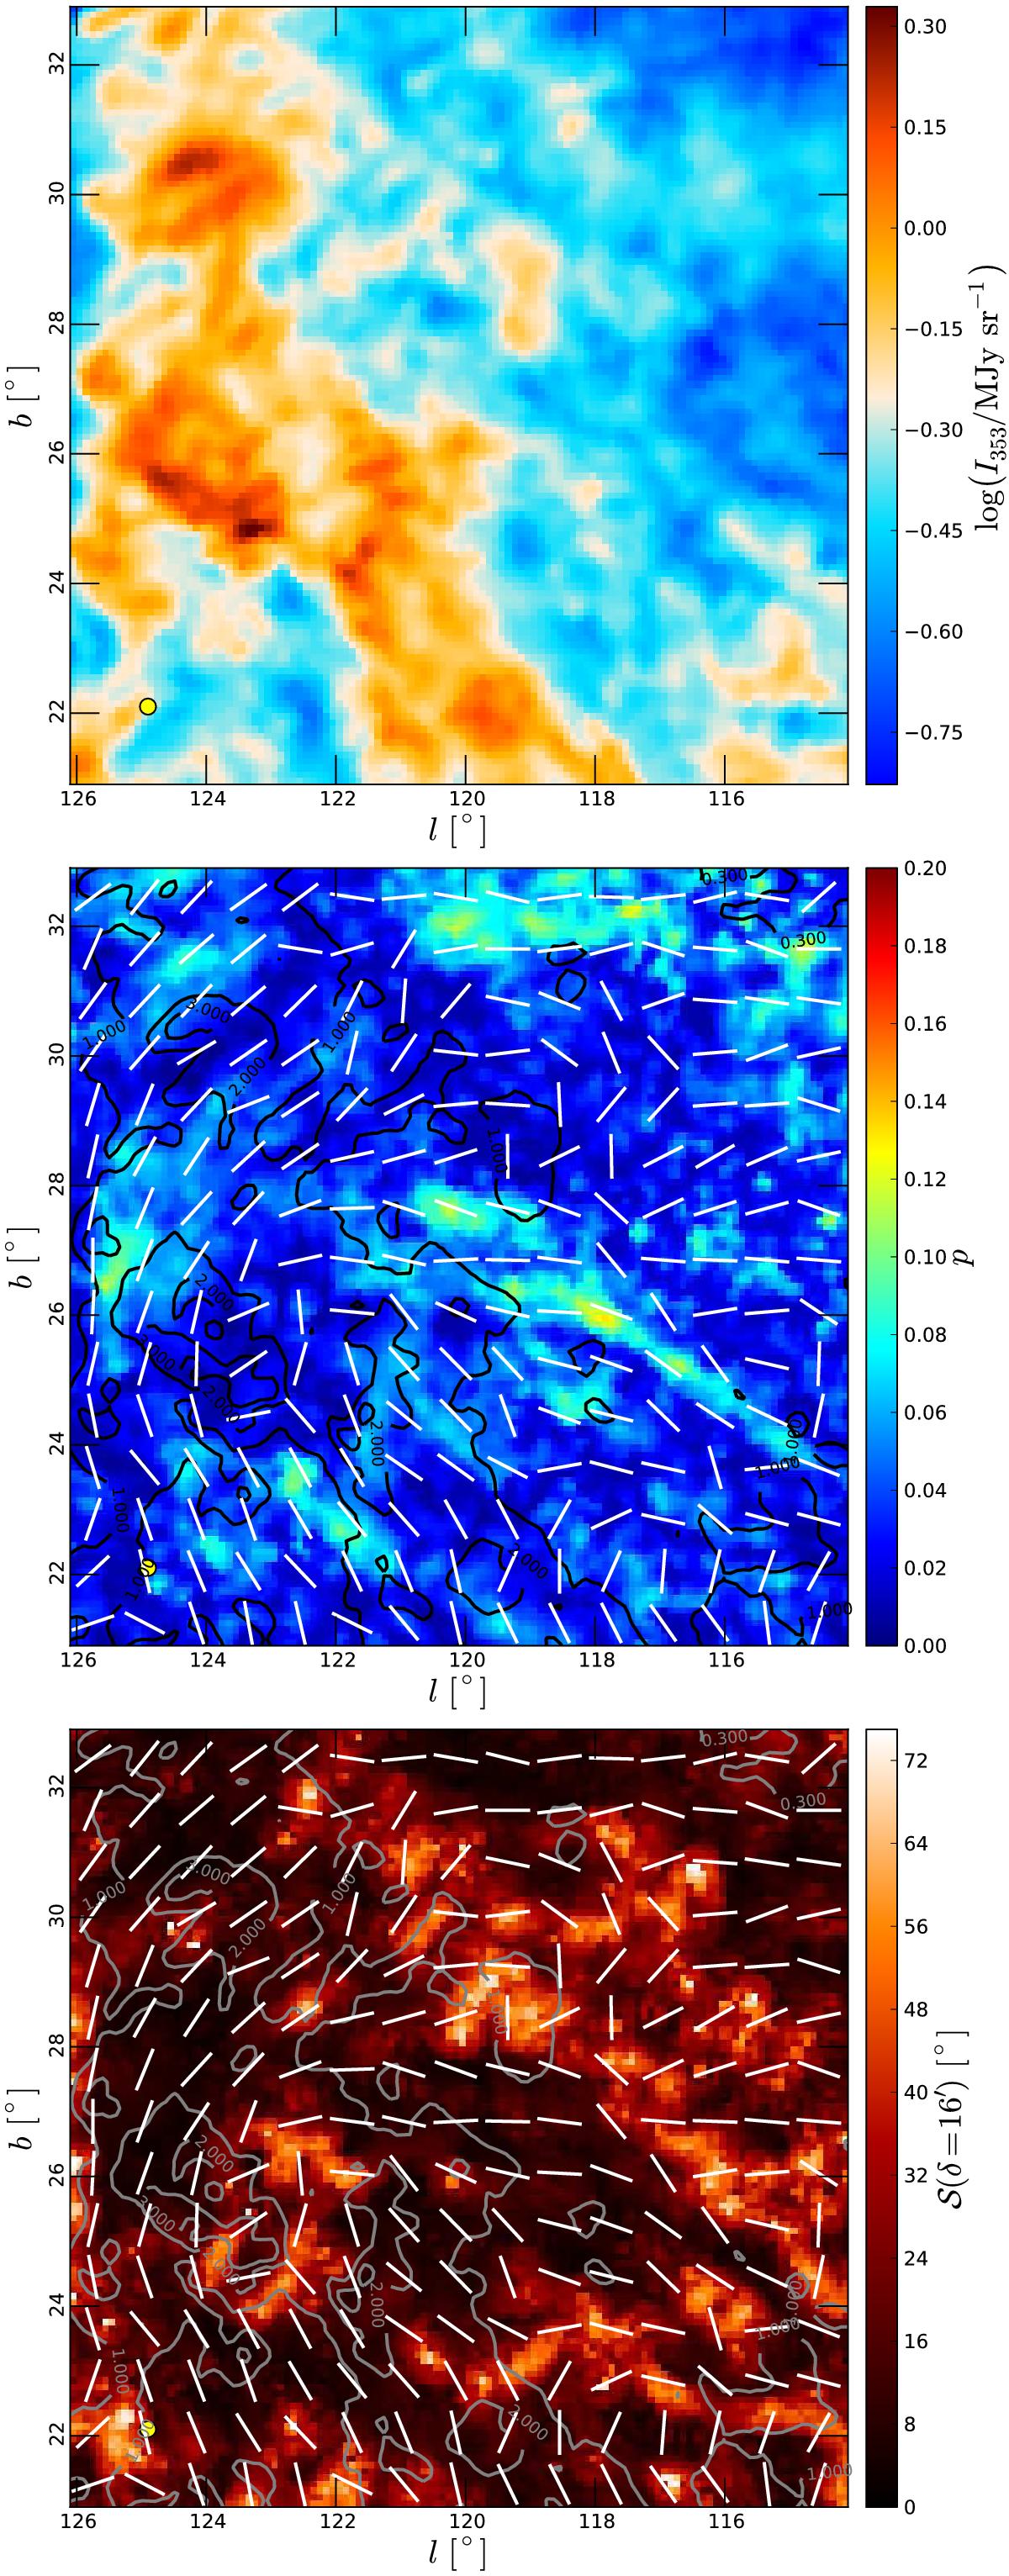
Same as Fig. 3, but for the Polaris Flare
field. Top: total intensity at 353 GHz. Middle:
polarization fraction p, column density NH
(contours in units of 1021
cm-2), and magnetic orientation (bars).
Bottom: angle dispersion function
![]() with lag δ =
16′ (see Sect. 2.5) with
contours and bars identical to the middle row. Note that contours levels are
different from those of Fig. 3.
with lag δ =
16′ (see Sect. 2.5) with
contours and bars identical to the middle row. Note that contours levels are
different from those of Fig. 3.
Current usage metrics show cumulative count of Article Views (full-text article views including HTML views, PDF and ePub downloads, according to the available data) and Abstracts Views on Vision4Press platform.
Data correspond to usage on the plateform after 2015. The current usage metrics is available 48-96 hours after online publication and is updated daily on week days.
Initial download of the metrics may take a while.