Fig. 20
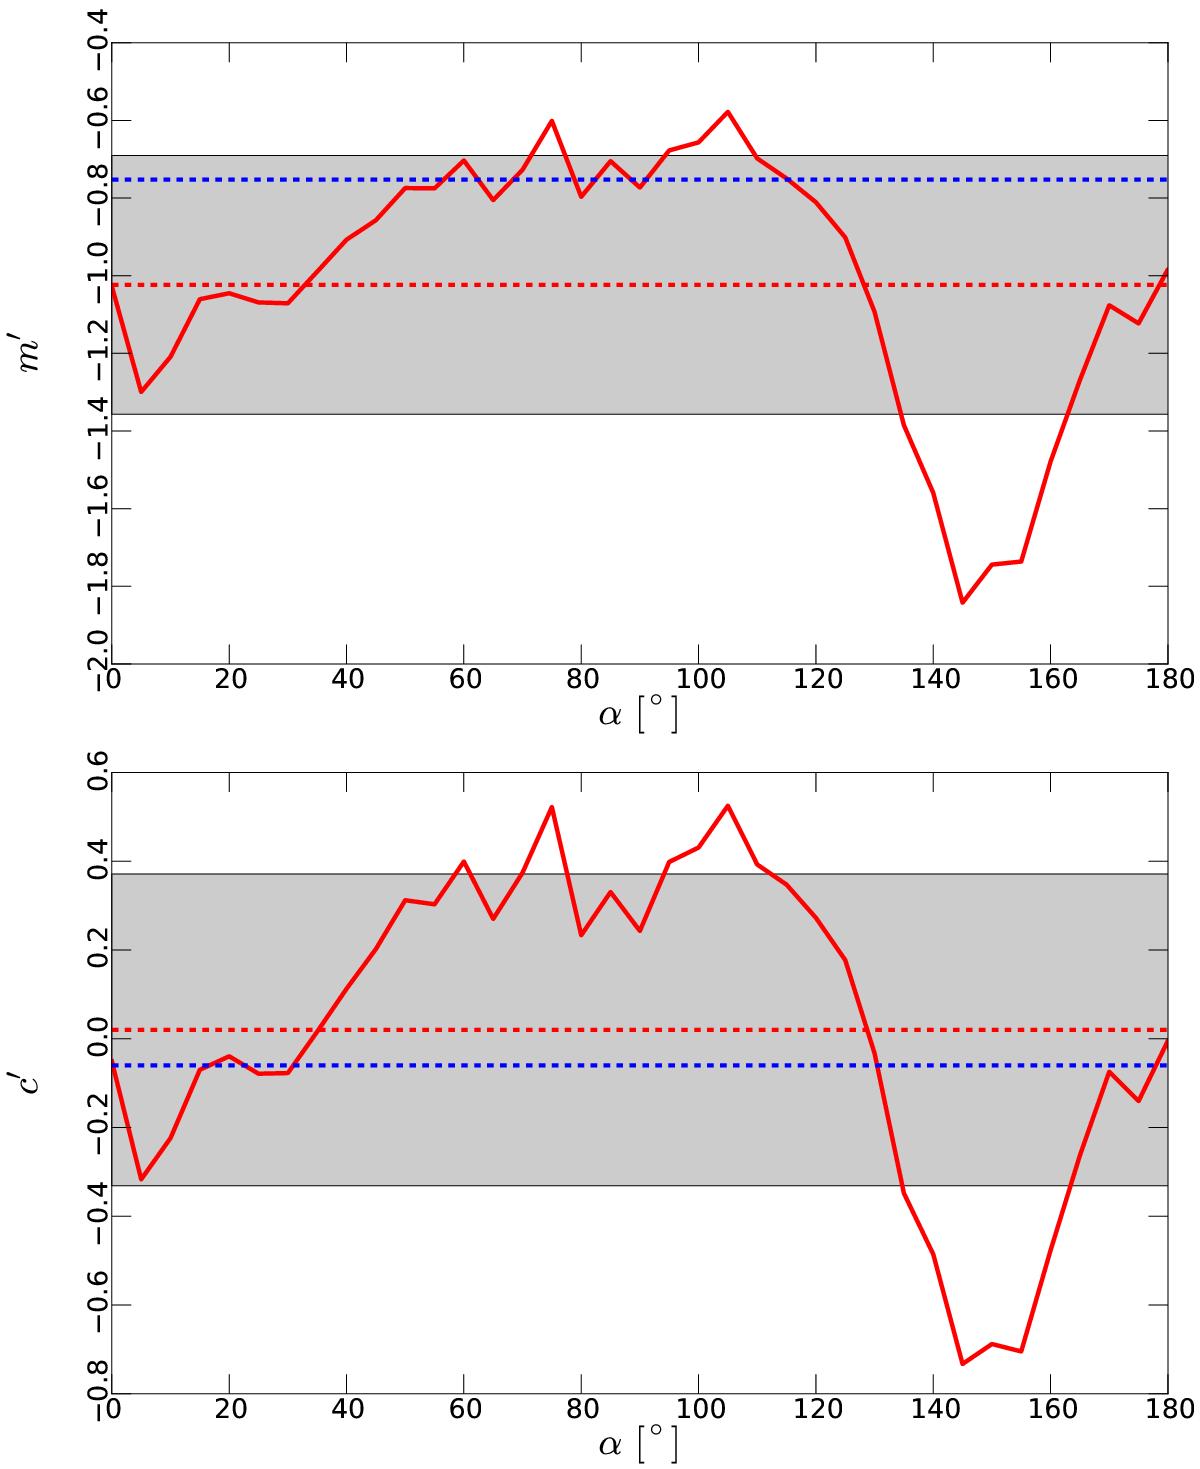
Slopes m′(top) and intercepts
c′(bottom) of the linear fits
![]() to the
distribution of log (p) and
to the
distribution of log (p) and
![]() in the simulated observations, as a function of viewing angle α. The lag is
δ =
16′. The dashed blue lines indicate the values for the
large-scale fit presented in Sect. 2.5, the
dashed red lines represent the average slope and intercept over the range of
α,
and the grey areas indicate ±
1σ around the mean, with the standard
deviation σ computed statistically over all angles.
in the simulated observations, as a function of viewing angle α. The lag is
δ =
16′. The dashed blue lines indicate the values for the
large-scale fit presented in Sect. 2.5, the
dashed red lines represent the average slope and intercept over the range of
α,
and the grey areas indicate ±
1σ around the mean, with the standard
deviation σ computed statistically over all angles.
Current usage metrics show cumulative count of Article Views (full-text article views including HTML views, PDF and ePub downloads, according to the available data) and Abstracts Views on Vision4Press platform.
Data correspond to usage on the plateform after 2015. The current usage metrics is available 48-96 hours after online publication and is updated daily on week days.
Initial download of the metrics may take a while.