Fig. 2
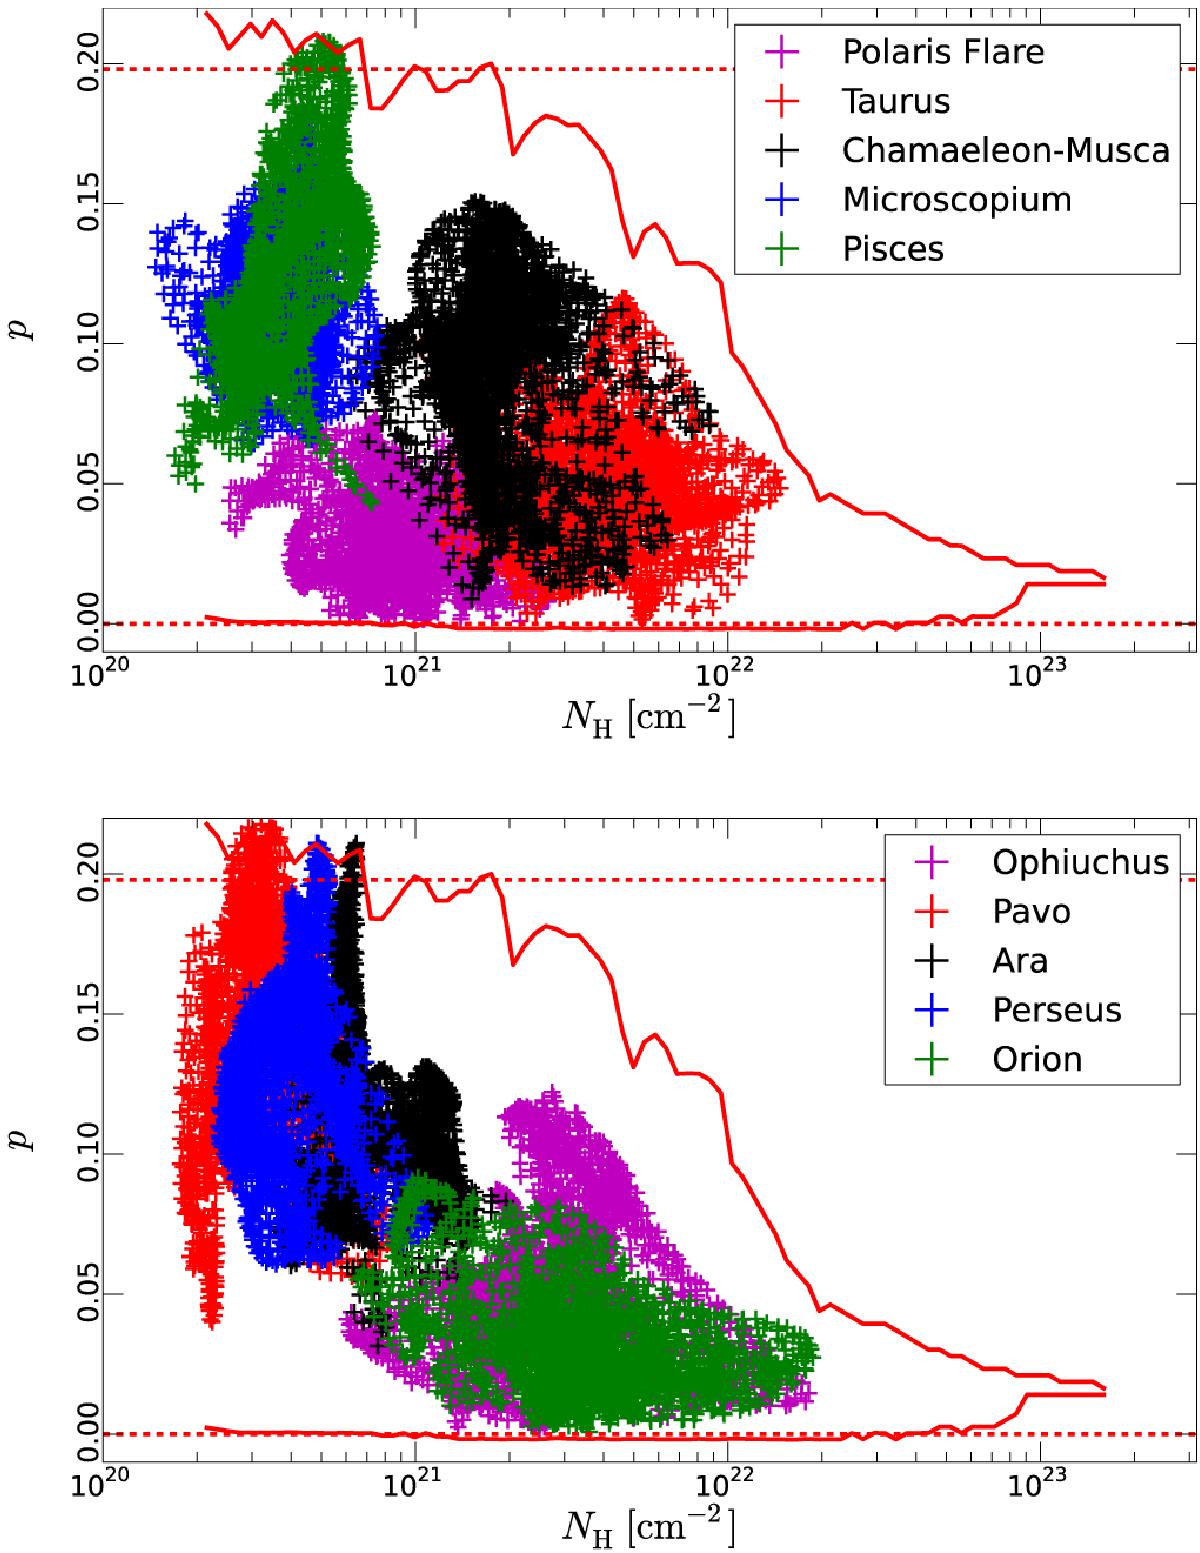
Two-dimensional distribution functions of polarization fraction p and column density NH in the fields highlighted in Fig. 1. Top: Polaris Flare (magenta), Taurus (red), Chamaeleon-Musca (black), Microscopium (blue), and Pisces (green). Bottom: Ophiuchus (magenta), Pavo (red), Ara (black), Perseus (blue), and Orion (green). On both panels, the solid red lines show the upper and lower envelopes (see text) of the large-scale distribution of p and NH, clipped below NH = 2 × 1020 cm-2, while the dashed red lines correspond to p = 0 and the maximum value p = 0.198 (i.e., 19.8%) quoted in Planck Collaboration Int. XIX (2014).
Current usage metrics show cumulative count of Article Views (full-text article views including HTML views, PDF and ePub downloads, according to the available data) and Abstracts Views on Vision4Press platform.
Data correspond to usage on the plateform after 2015. The current usage metrics is available 48-96 hours after online publication and is updated daily on week days.
Initial download of the metrics may take a while.