Fig. 19
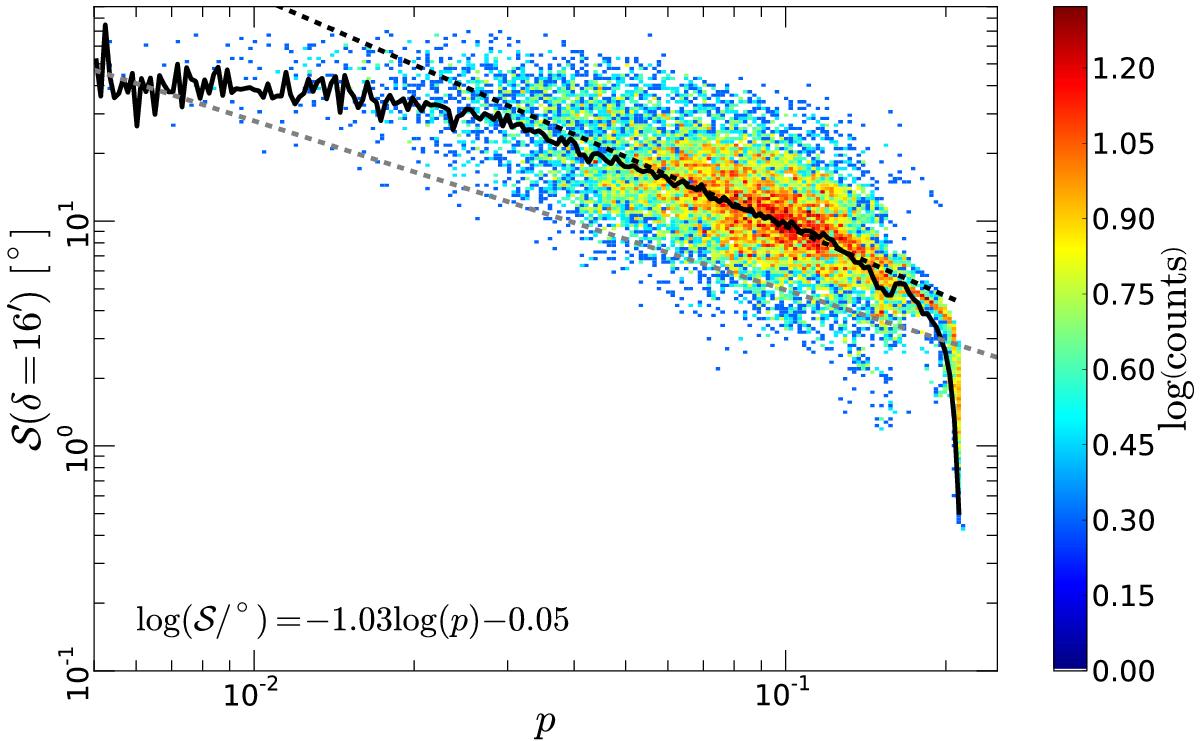
Two-dimensional distribution function of log (p) and
![]() in the simulated observations for δ = 16′ and α = 0°. The solid
black curve represents the evolution of the mean
in the simulated observations for δ = 16′ and α = 0°. The solid
black curve represents the evolution of the mean
![]() per bin of log (p). A linear fit
per bin of log (p). A linear fit
![]() is
performed, restricted to bins in log (p) that contain at least 1% of the total
number of points. This fit is shown as the dashed black line. The dashed grey line
is the large-scale fit presented in Sect. 2.5.
is
performed, restricted to bins in log (p) that contain at least 1% of the total
number of points. This fit is shown as the dashed black line. The dashed grey line
is the large-scale fit presented in Sect. 2.5.
Current usage metrics show cumulative count of Article Views (full-text article views including HTML views, PDF and ePub downloads, according to the available data) and Abstracts Views on Vision4Press platform.
Data correspond to usage on the plateform after 2015. The current usage metrics is available 48-96 hours after online publication and is updated daily on week days.
Initial download of the metrics may take a while.