Fig. 18
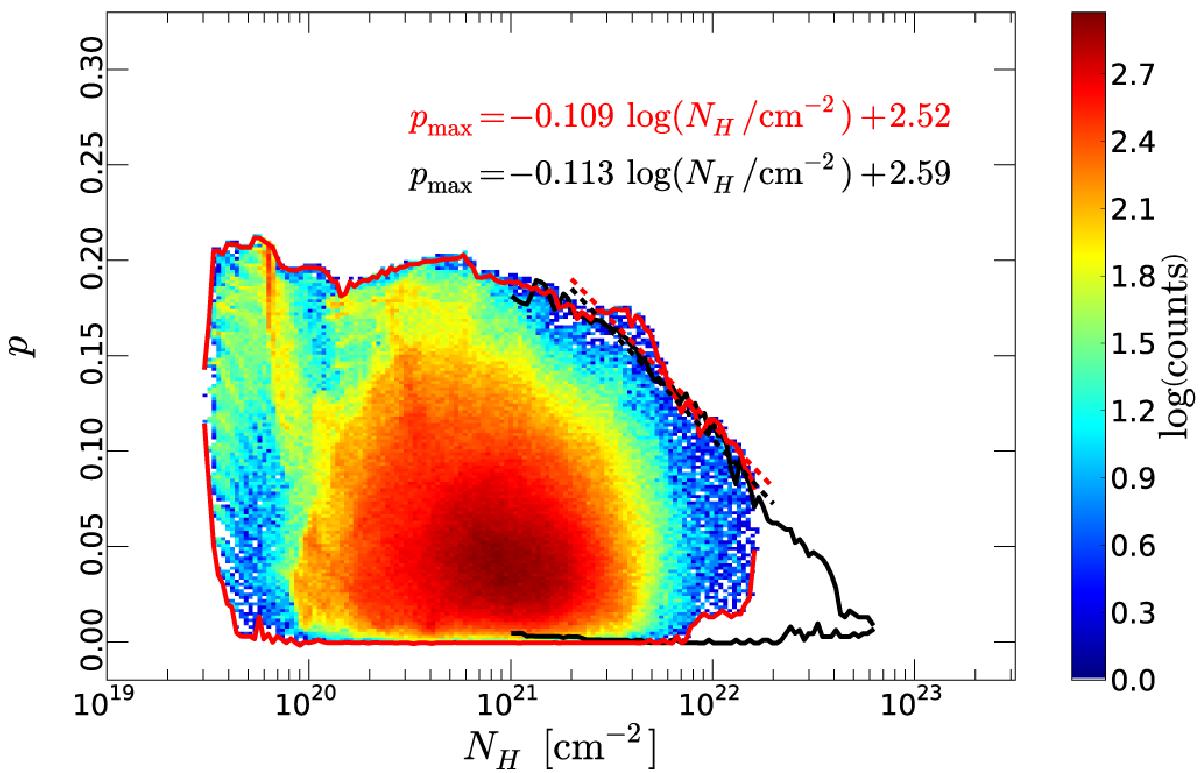
Comparison between the distributions of the polarization fractions p and logarithmic
column densities in the simulations (colour scale, all viewing angles combined, with
upper and lower envelopes in solid red lines) and those of the observations in the
selected fields (solid black lines). Note that the latter are restricted to
NH>
1021 cm-2. Dashed lines are linear fits
of the form ![]() on the distributions’ upper
envelopes, restricted to a common range of column densities 2 × 10²¹
cm-2<NH < 2 × 10²²
cm-2.
on the distributions’ upper
envelopes, restricted to a common range of column densities 2 × 10²¹
cm-2<NH < 2 × 10²²
cm-2.
Current usage metrics show cumulative count of Article Views (full-text article views including HTML views, PDF and ePub downloads, according to the available data) and Abstracts Views on Vision4Press platform.
Data correspond to usage on the plateform after 2015. The current usage metrics is available 48-96 hours after online publication and is updated daily on week days.
Initial download of the metrics may take a while.