Fig. 16
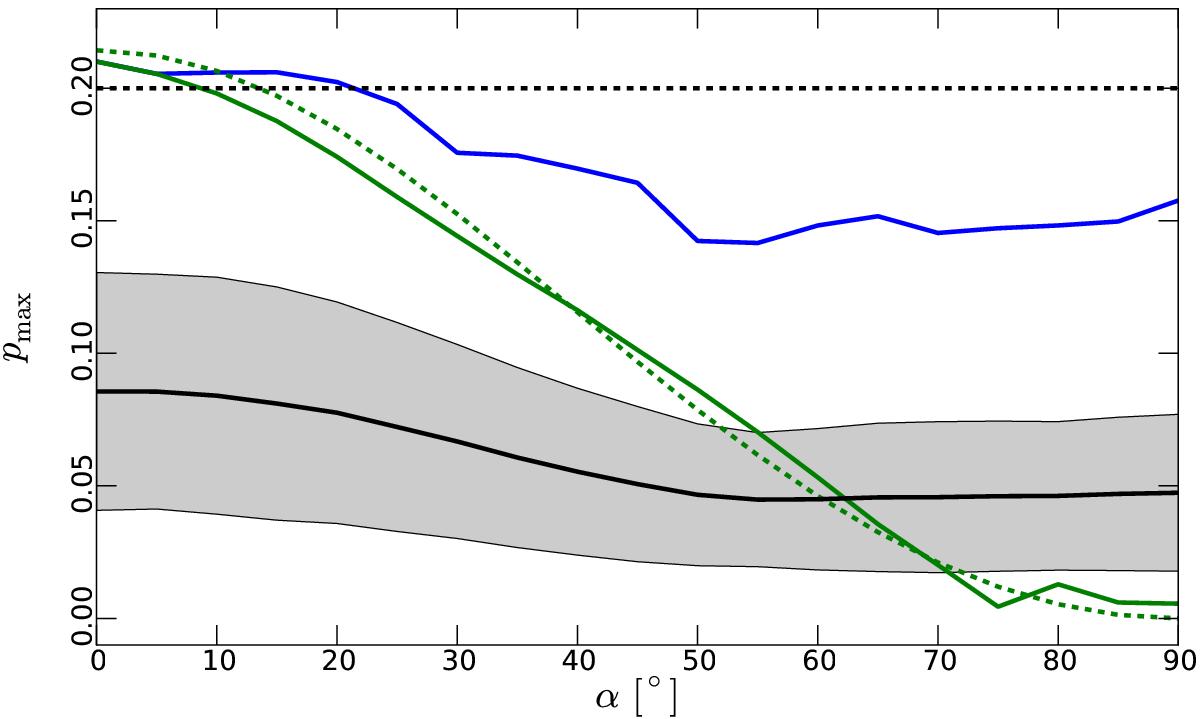
Statistics of polarization fractions in the simulated Planck observations as a function of viewing angle α (see Fig. 13). The solid blue line shows pmax, the solid black line shows the mean p, and the solid green line shows the value of p for the most diffuse lines of sight in the map. The dashed black line marks the polarization fraction parameter p0 and the dashed green line gives the theoretical polarization fraction in the case where the density and magnetic field are homogeneous and the latter makes an angle α with the plane of the sky (see text). The grey region shows the ± 1σ spread around the mean p.
Current usage metrics show cumulative count of Article Views (full-text article views including HTML views, PDF and ePub downloads, according to the available data) and Abstracts Views on Vision4Press platform.
Data correspond to usage on the plateform after 2015. The current usage metrics is available 48-96 hours after online publication and is updated daily on week days.
Initial download of the metrics may take a while.