Fig. 15
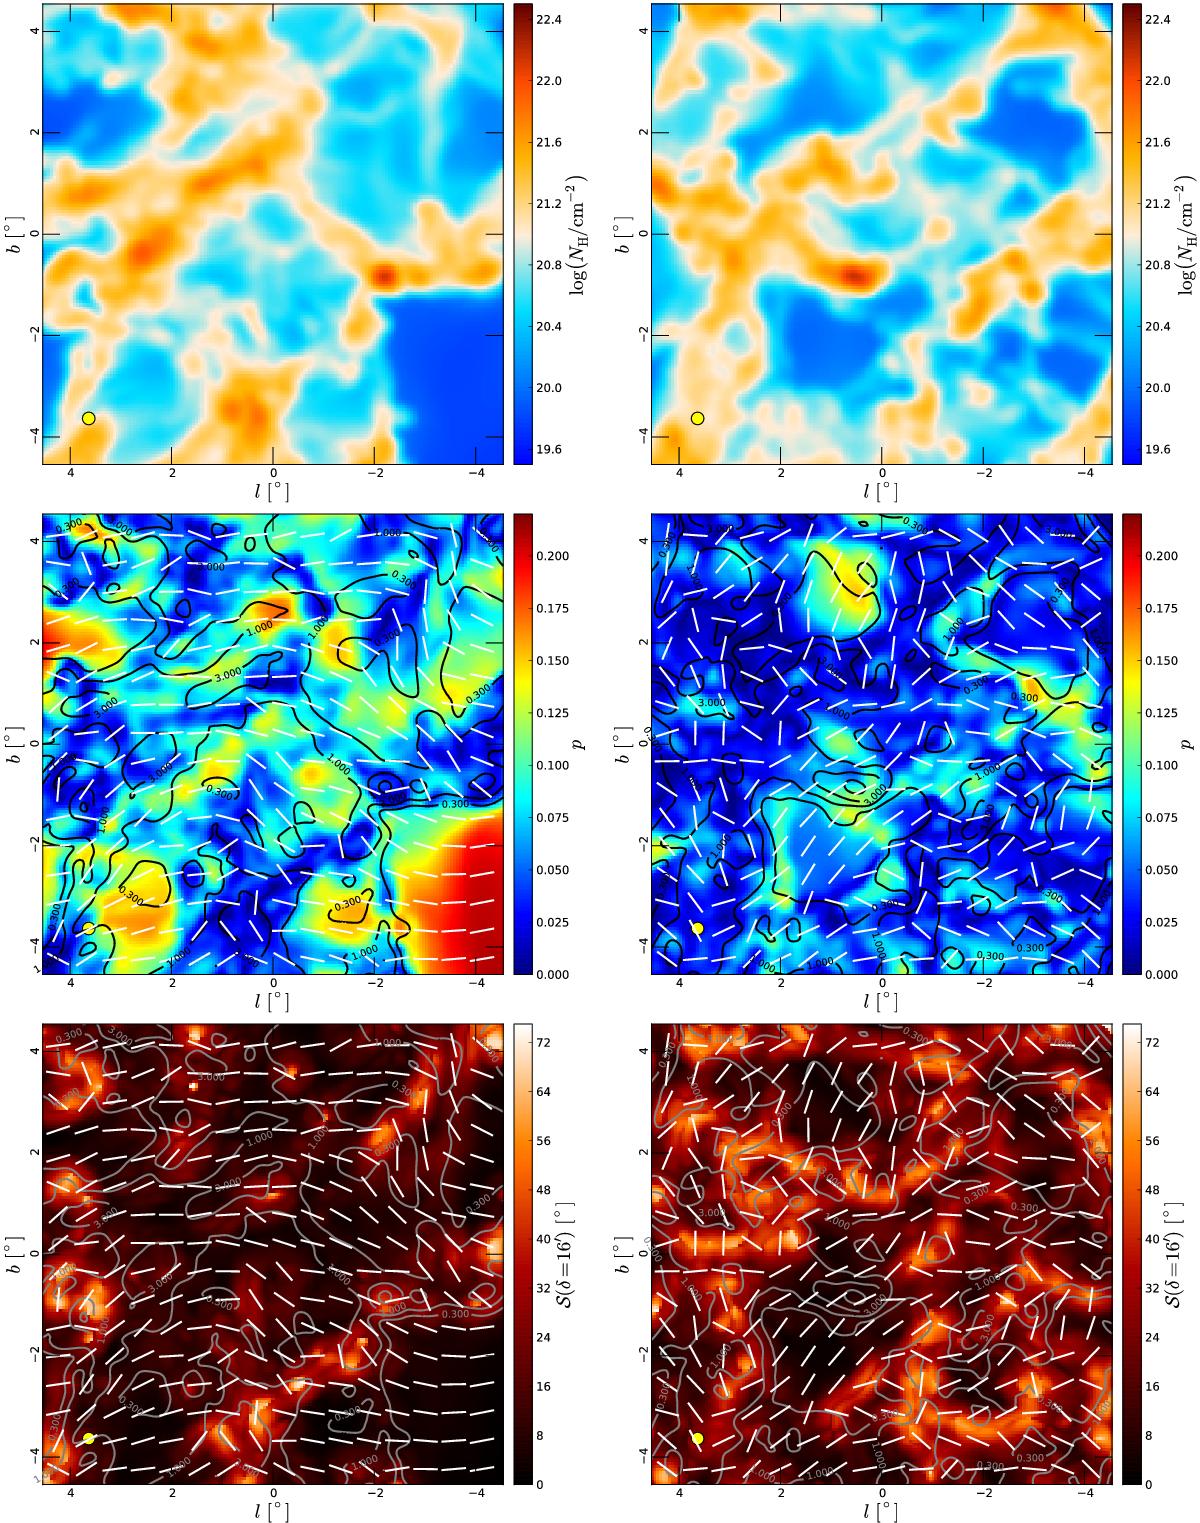
Simulated Planck maps. Top: total gas column density. Middle: polarization fraction and angle, with contours being the column density at values indicated in units of 1021 cm-2, and the bars indicate magnetic orientation. Bottom: angle dispersion function at lag δ = 16′, with the same contours and bars as in the middle row. Left: viewing angle α = 0°. Right: viewing angle α = 90°. In each row, the same colour scale is used. In the lower left corner of each plot (yellow circle) is the 15′ FWHM beam.
Current usage metrics show cumulative count of Article Views (full-text article views including HTML views, PDF and ePub downloads, according to the available data) and Abstracts Views on Vision4Press platform.
Data correspond to usage on the plateform after 2015. The current usage metrics is available 48-96 hours after online publication and is updated daily on week days.
Initial download of the metrics may take a while.