Fig. 9
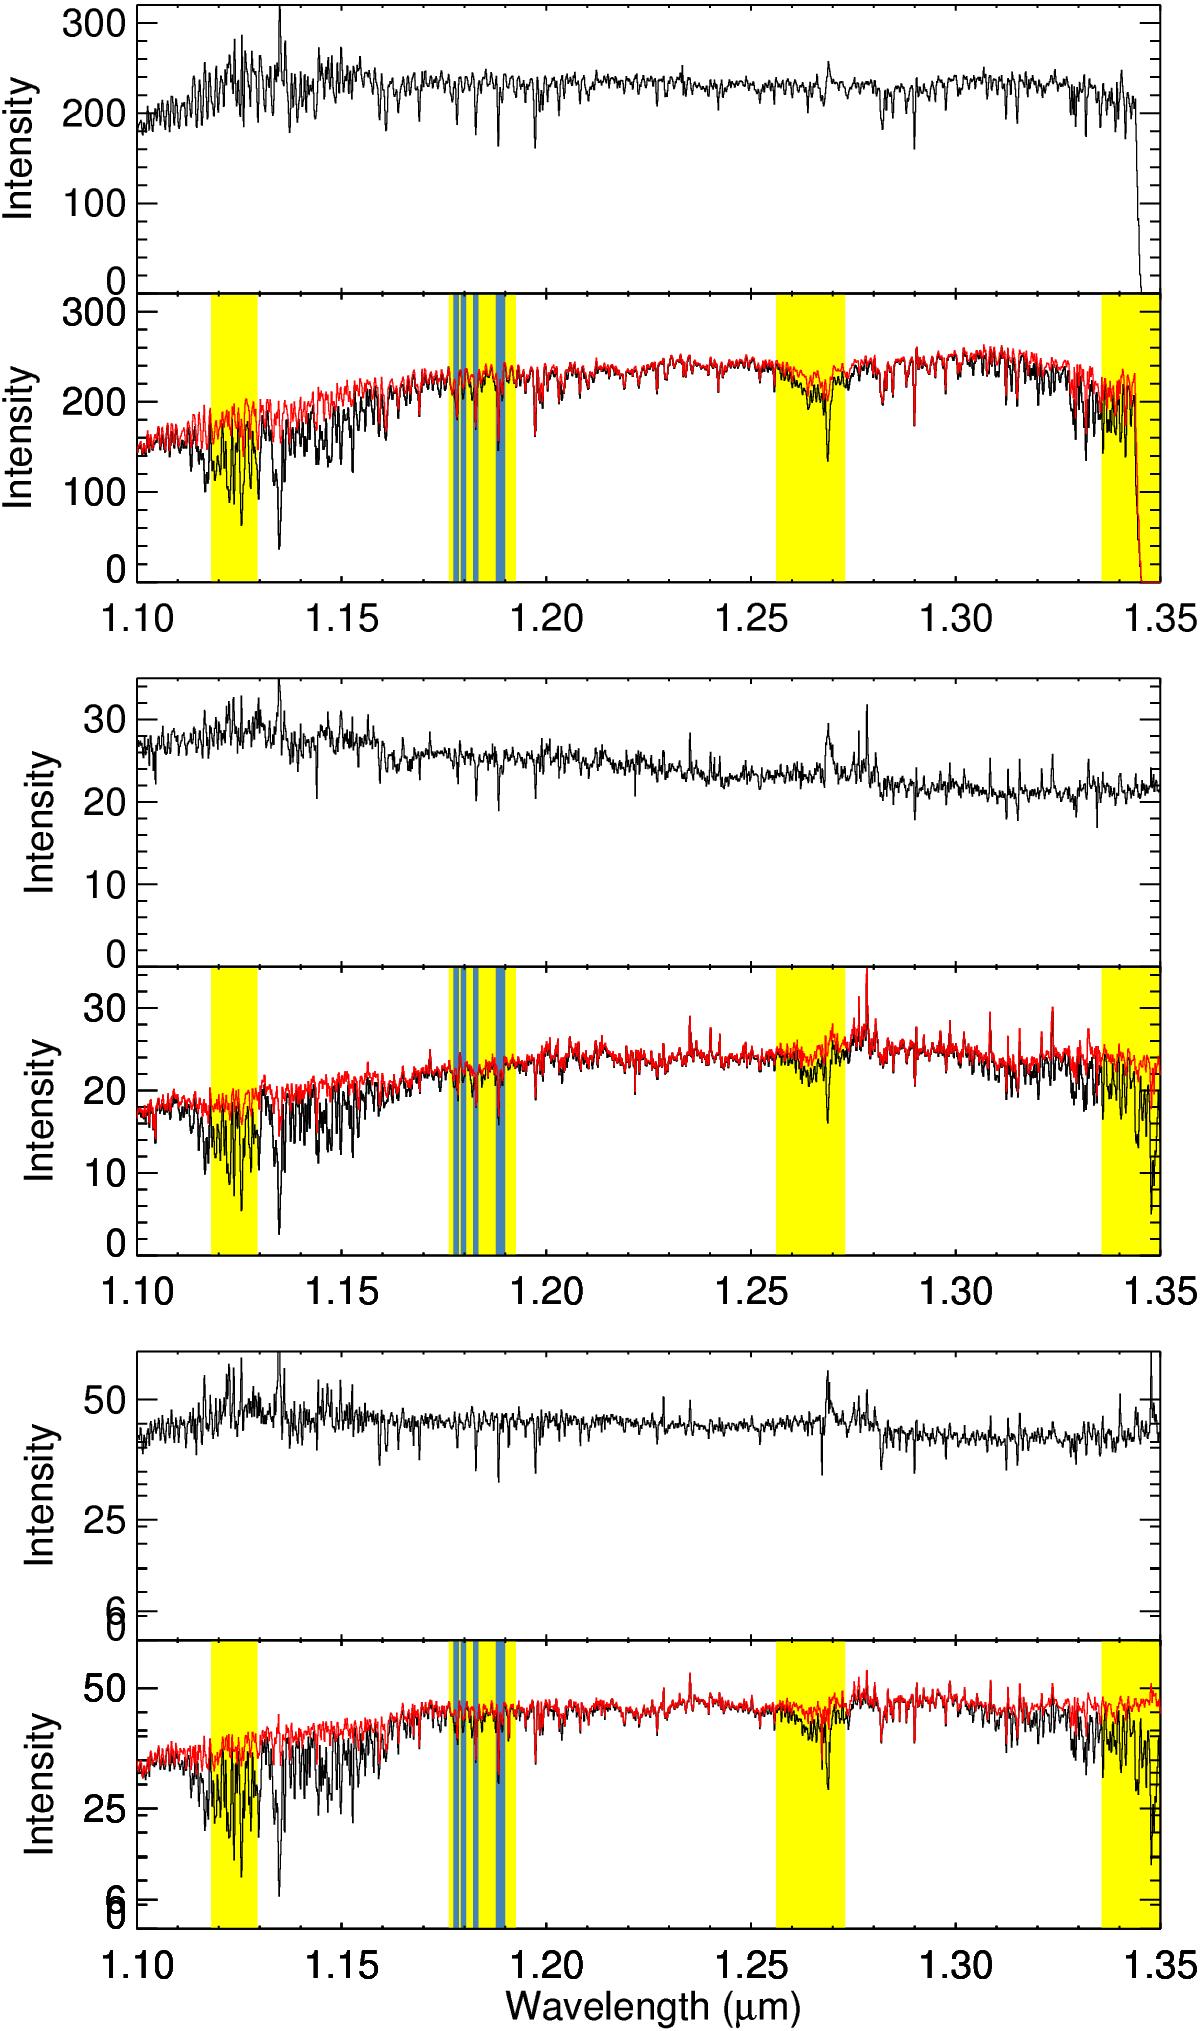
KMOS spectra of 3 red supergiant stars in NGC 6822, each feeding a different spectrograph. From top to bottom: star #40, star #36, and star #8. In each figure, the bottom graph shows the reduced data in black, while the spectra corrected by the synthetic spectrum determined by molecfit is shown in red; the top graph shows the star spectrum corrected by the telluric star observed just after. The molecular column densities were determined using only the spectrum of star #8: the results were used on the spectra of stars #36 and #40. The line spread functions were, however, determined on each spectrum independently. The yellow shaded areas indicate the inclusion regions, while the blue shaded areas show the regions excluded from the fit because they correspond to spectral features intrinsic to the stars.
Current usage metrics show cumulative count of Article Views (full-text article views including HTML views, PDF and ePub downloads, according to the available data) and Abstracts Views on Vision4Press platform.
Data correspond to usage on the plateform after 2015. The current usage metrics is available 48-96 hours after online publication and is updated daily on week days.
Initial download of the metrics may take a while.