Free Access
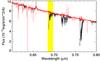
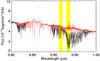
Fig. 7

Visible arm X-shooter spectrum of R71 LBV star. The pipeline reduced spectrum is shown in black. The shaded areas show the inclusion regions used to model the line spread function and determine the column densities of H2O and O2. The spectrum corrected by the derived transmission spectrum is shown in red.
This figure is made of several images, please see below:
Current usage metrics show cumulative count of Article Views (full-text article views including HTML views, PDF and ePub downloads, according to the available data) and Abstracts Views on Vision4Press platform.
Data correspond to usage on the plateform after 2015. The current usage metrics is available 48-96 hours after online publication and is updated daily on week days.
Initial download of the metrics may take a while.