Free Access
Fig. 12
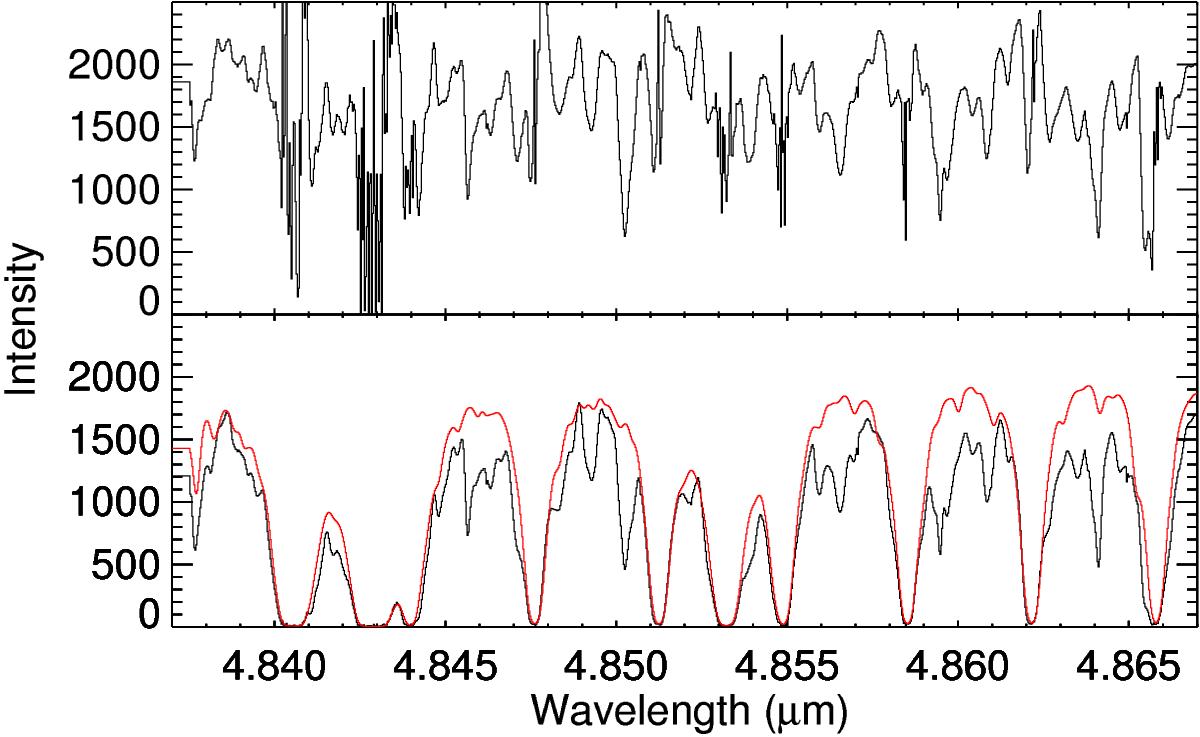
Extract (detector #2) of CRIRES 4889.5 nm setting spectra of X TrA; the red spectrum shows the molecfit-derived transmission spectrum scaled by a constant factor. The top graph shows the corrected spectrum. Molecfit was used in expert mode in this case.
Current usage metrics show cumulative count of Article Views (full-text article views including HTML views, PDF and ePub downloads, according to the available data) and Abstracts Views on Vision4Press platform.
Data correspond to usage on the plateform after 2015. The current usage metrics is available 48-96 hours after online publication and is updated daily on week days.
Initial download of the metrics may take a while.