Fig. 1
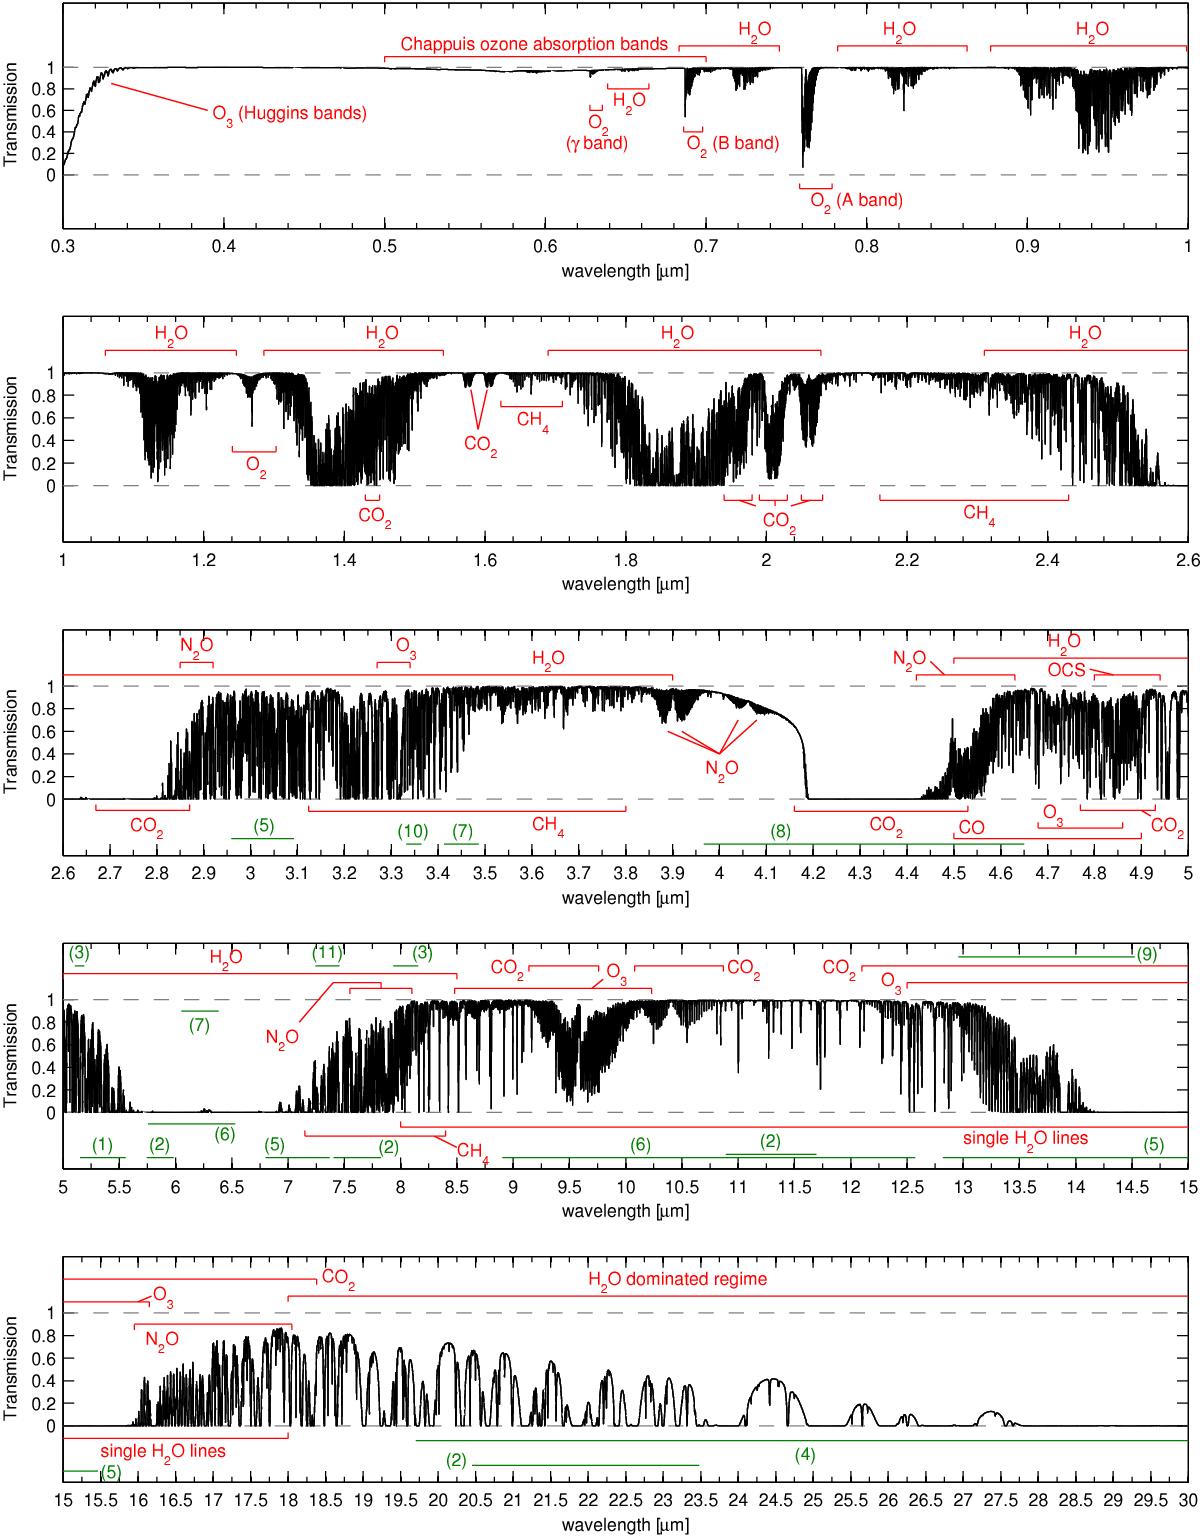
Synthetic absorption spectrum of the sky between 0.3 and 30 μm calculated with LBLRTM (resolution R ~ 10 000) using the annual mean profile for Cerro Paranal (Noll et al. 2012). The eight main molecules O2, O3, H2O, CO, CO2, CH4, OCS, and N2O contribute more than 5% to the absorption in some wavelength regimes. The red regions mark the ranges where they mainly affect the transmission, minor contributions of these molecules are not shown. The green regions denote minor contributions (see Table 1) from the following molecules: (1) NO; (2) HNO3; (3) COF2; (4) H2O2; (5) HCN; (6) NH3; (7) NO2; (8) N2; (9) C2H2; (10) C2H6; and (11) SO2.
Current usage metrics show cumulative count of Article Views (full-text article views including HTML views, PDF and ePub downloads, according to the available data) and Abstracts Views on Vision4Press platform.
Data correspond to usage on the plateform after 2015. The current usage metrics is available 48-96 hours after online publication and is updated daily on week days.
Initial download of the metrics may take a while.