Fig. 2
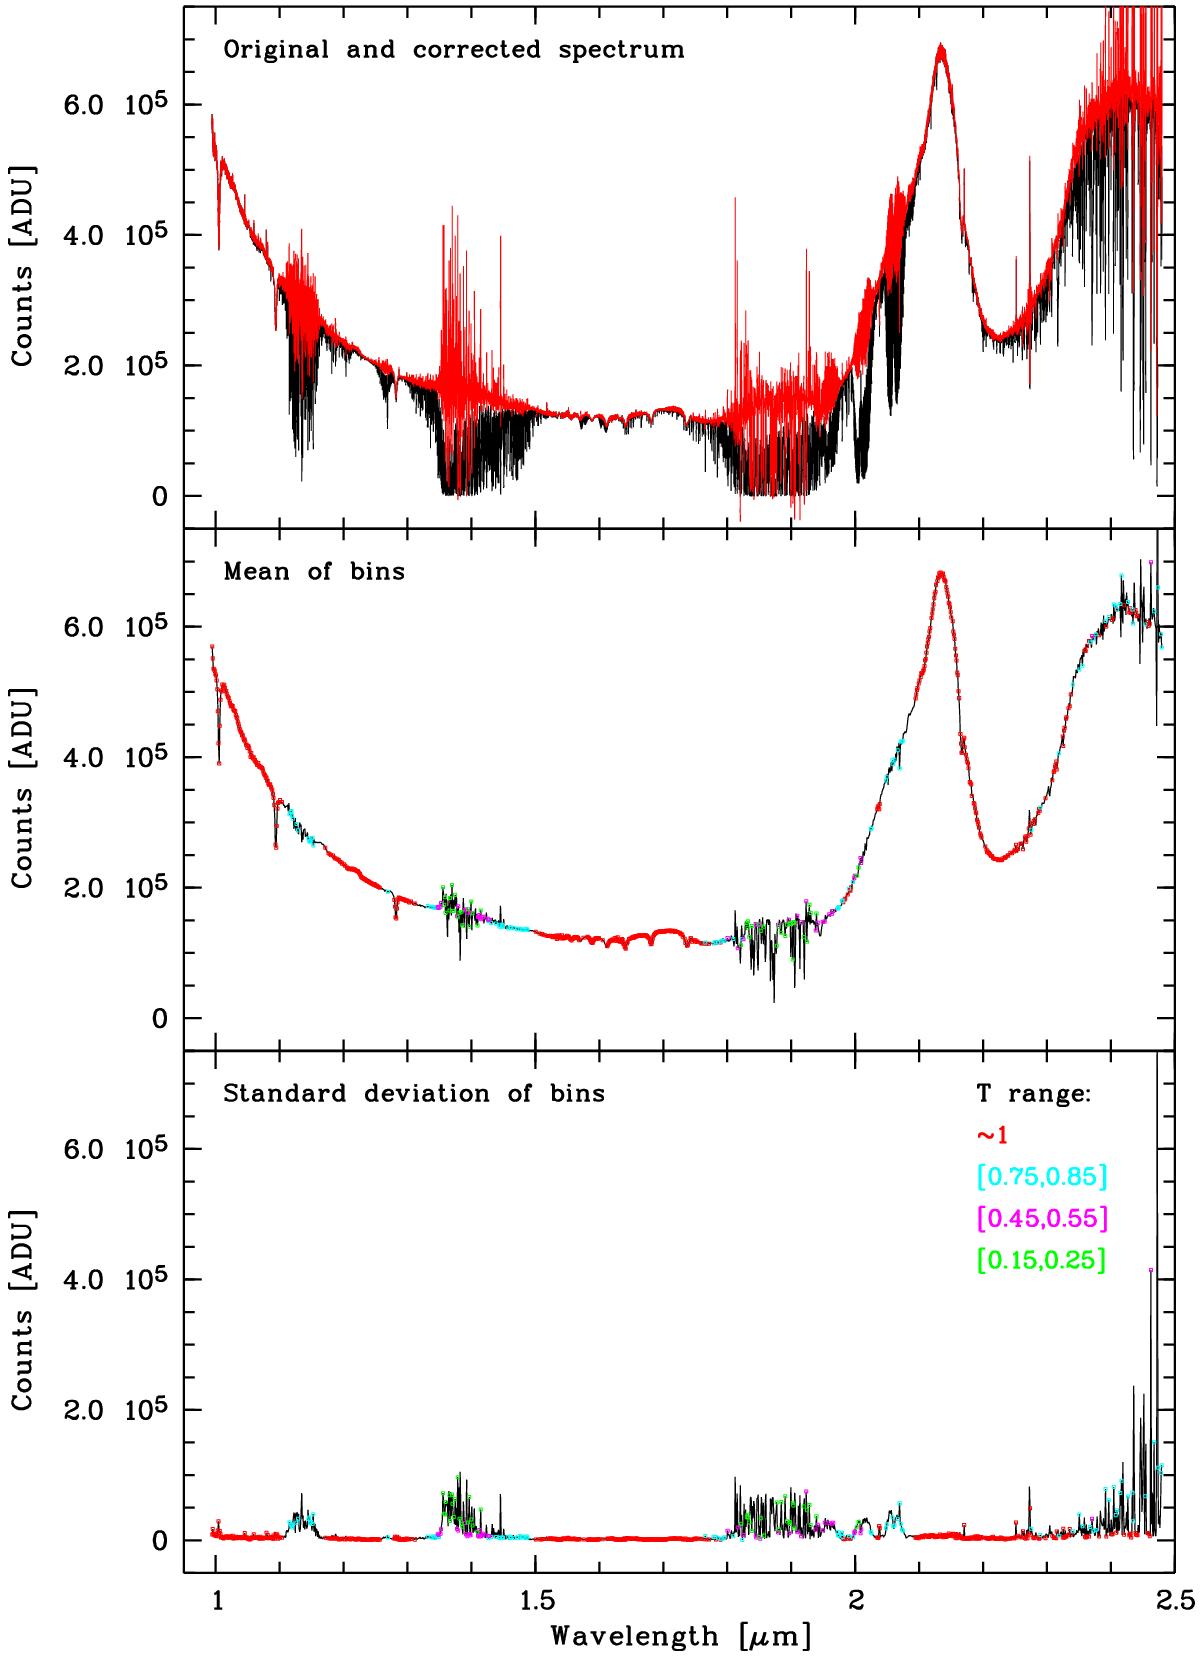
Quality of telluric absorption correction for an example TSS spectrum taken with the NIR arm of the X-Shooter spectrograph. The star was observed with a 1.2′′ slit at an airmass of 1.32. The seeing was 0.76′′ and the PWV (as derived from the fitting) was 1.46 mm. Upper panel: telluric absorption corrected spectrum (red) is shown in comparison with the original spectrum (black). Middle and lower panels: mean counts and standard deviation in ADU for a grid of 1 nm bins for the telluric absorption corrected example spectrum. The two subfigures also highlight the pixels for the continuum interpolation (red) and the different transmission ranges for the quality analysis of the telluric absorption correction. For more details, see Fig. 1.
Current usage metrics show cumulative count of Article Views (full-text article views including HTML views, PDF and ePub downloads, according to the available data) and Abstracts Views on Vision4Press platform.
Data correspond to usage on the plateform after 2015. The current usage metrics is available 48-96 hours after online publication and is updated daily on week days.
Initial download of the metrics may take a while.