Fig. 16
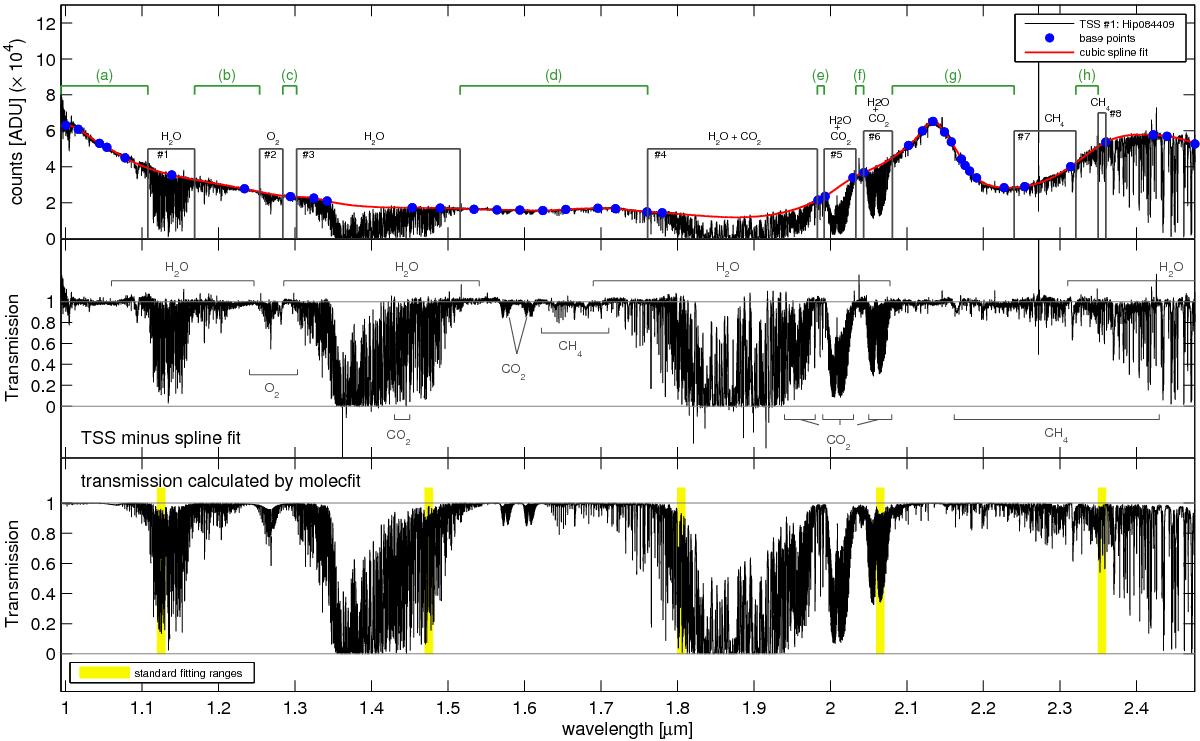
Upper panel: telluric standard star spectrum Hip084409 (test data set #3, see Tables 1 and 2) and the fitting method for extracting a transmission curve: a cubic spline fit to base points (blue dots in upper panel) is used to derive the continuum of the telluric standard star. This fit is then used to normalise the spectrum to achieve the corresponding transmission (lower panel). We divided the spectrum into several wavelength regions based on the amount of absorption. Regions #1 through #8 are heavily affected by absorption, in contrast to regions (a) through (h) (see Table 11). Each region was corrected individually with molecfit and IRAF. Middle panel: resulting transmission curve including some molecular absorption features. Lower panel: theoretical transmission curve achieved with molecfit.
Current usage metrics show cumulative count of Article Views (full-text article views including HTML views, PDF and ePub downloads, according to the available data) and Abstracts Views on Vision4Press platform.
Data correspond to usage on the plateform after 2015. The current usage metrics is available 48-96 hours after online publication and is updated daily on week days.
Initial download of the metrics may take a while.