Free Access
Fig. 6
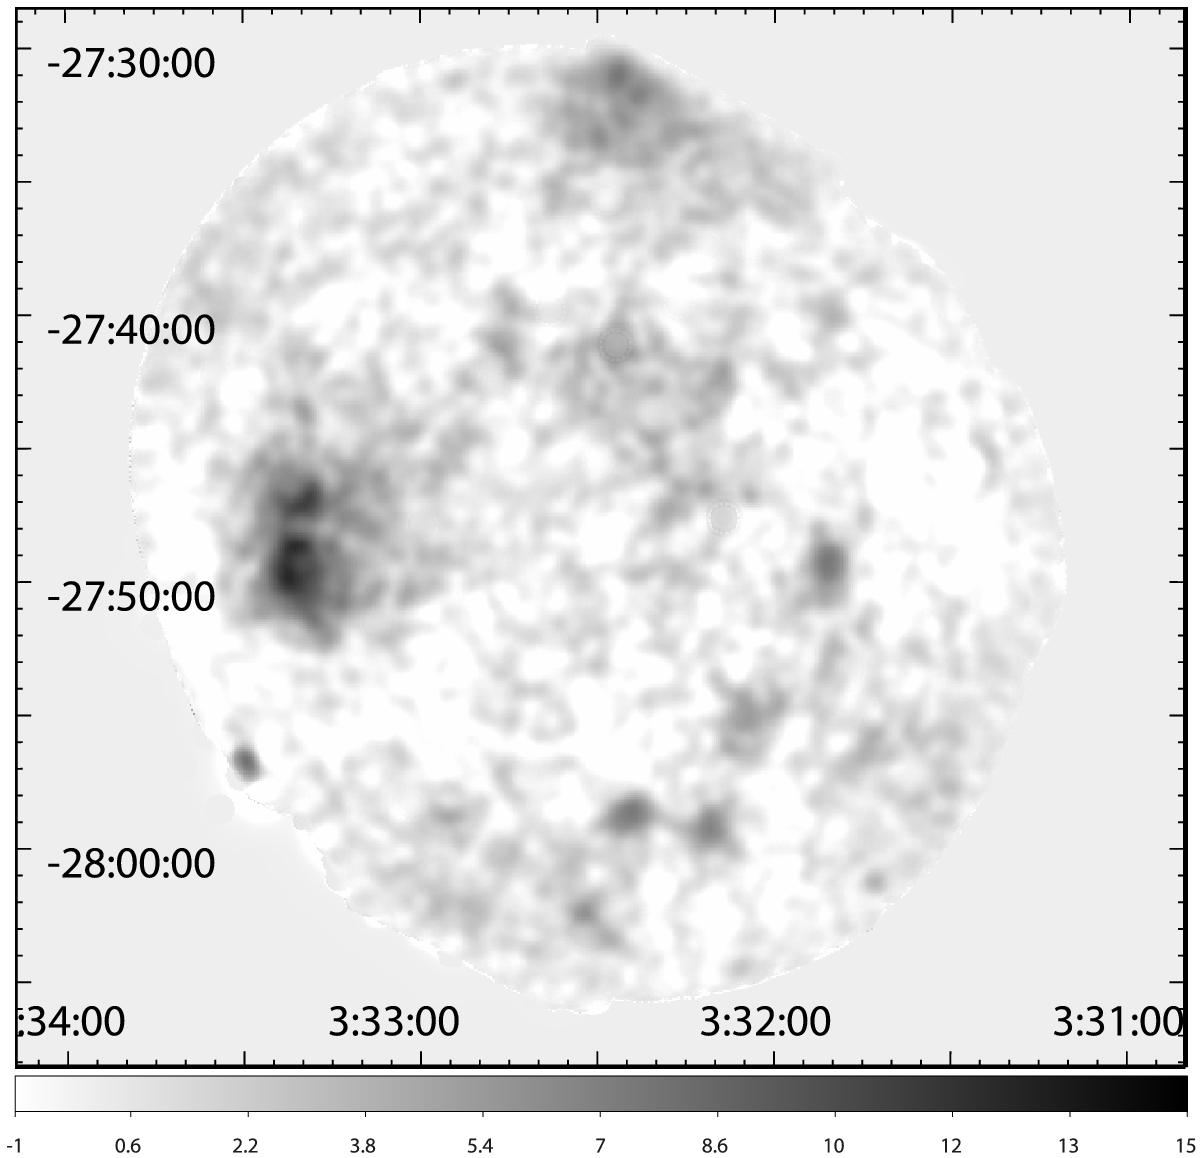
Signal-to-noise of the XMM data after point source removal and smoothing with a 16′′ Gaussian kernel. The color bar shows the correspondence between the color and the significance of the emission, starting with white for −1σ.
Current usage metrics show cumulative count of Article Views (full-text article views including HTML views, PDF and ePub downloads, according to the available data) and Abstracts Views on Vision4Press platform.
Data correspond to usage on the plateform after 2015. The current usage metrics is available 48-96 hours after online publication and is updated daily on week days.
Initial download of the metrics may take a while.