Fig. 21
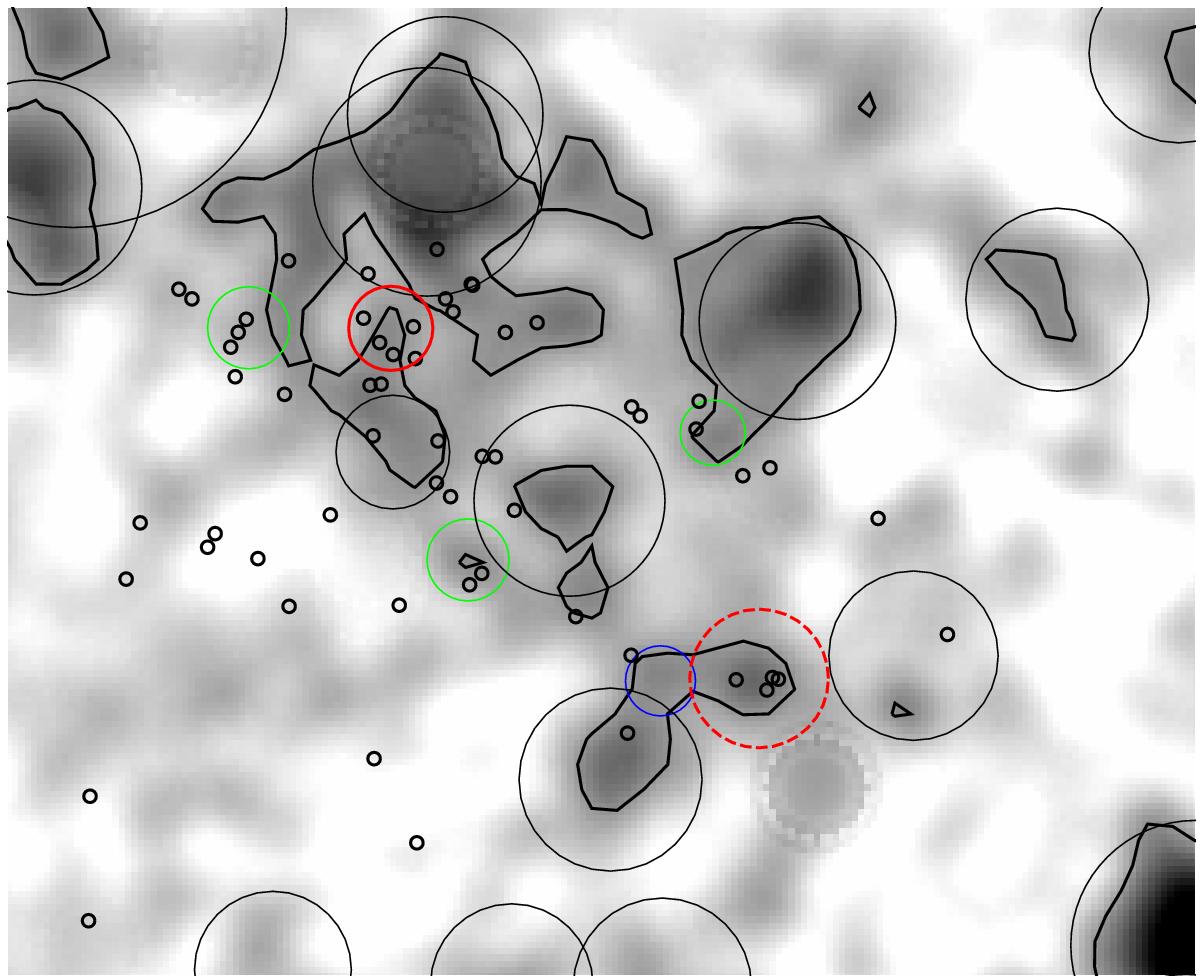
Signal-to-noise map of X-ray residuals in the 0.5–2 keV band, after removing the point sources. The black circles show the location of the primary identifications. The solid red circle is the center of the Kurk superstructure and the solid green sources are other peaks on the photo-z at z = 1.6 with sufficient spectra and the blue circle is a photo-z peak with just one spectrum, all found in the map of Kurk et al. Small solid circles indicate the spectroscopic members of the 1.6 wall and the dashed red circle is the highest significance X-ray source at z = 1.6 presented in Tanaka et al. (2013). The radii of the circles correspond to R200, also giving a sense of the angular/physical scale (e.g. Tanaka’s group has a radii of 0.7′), with the coordinates of the circle centers listed in Table 4.
Current usage metrics show cumulative count of Article Views (full-text article views including HTML views, PDF and ePub downloads, according to the available data) and Abstracts Views on Vision4Press platform.
Data correspond to usage on the plateform after 2015. The current usage metrics is available 48-96 hours after online publication and is updated daily on week days.
Initial download of the metrics may take a while.