Fig. 2
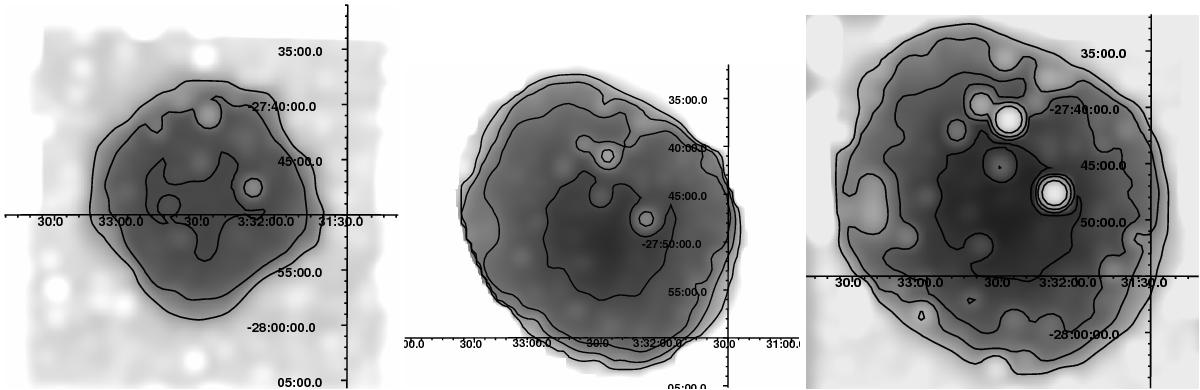
Sensitivity of Chandra and XMM towards the detection of X-ray emission on 32′′ scales. Contours show the levels of 1.2,2,3, and 5 × 10-16 ergs s-1 cm-2 and provide the intensity scale in the image. Left: all Chandra observations. The sensitivity does not reach the deepest contour. Middle: All XMM observations. Right: Chandra plus XMM.
Current usage metrics show cumulative count of Article Views (full-text article views including HTML views, PDF and ePub downloads, according to the available data) and Abstracts Views on Vision4Press platform.
Data correspond to usage on the plateform after 2015. The current usage metrics is available 48-96 hours after online publication and is updated daily on week days.
Initial download of the metrics may take a while.