Fig. 17
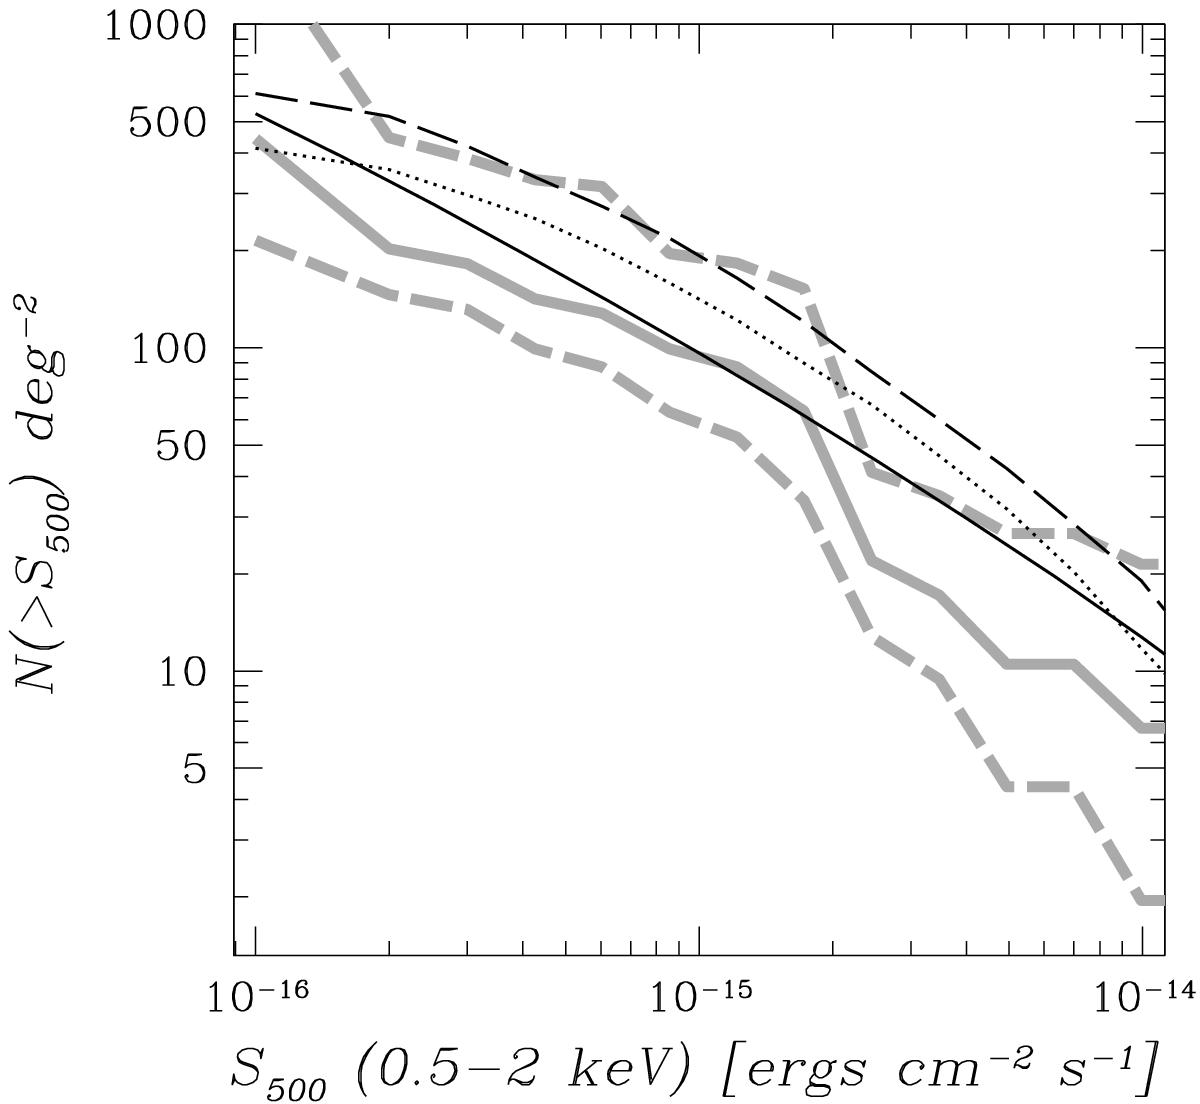
log (N>S) − log (S) of X-ray groups. The grey curves show ECDF-S data and the 1σ envelope shown as dashed curves. The solid black curve shows the prediction of a non-evolving X-ray luminosity function from Rosati et al. (2002). The long-dashed line shows the simulated detected counts using Planck cosmology (Planck Collaboration XXVI 2014) and the Leauthaud et al. (2010) scaling relation. The dotted line, illustrates the effect on changing the normalisation of scaling relations by increasing the associated mass by 30%, allowed by our calibration at faint fluxes (below 10-15 ergs s-1 cm-2).
Current usage metrics show cumulative count of Article Views (full-text article views including HTML views, PDF and ePub downloads, according to the available data) and Abstracts Views on Vision4Press platform.
Data correspond to usage on the plateform after 2015. The current usage metrics is available 48-96 hours after online publication and is updated daily on week days.
Initial download of the metrics may take a while.