Fig. 16
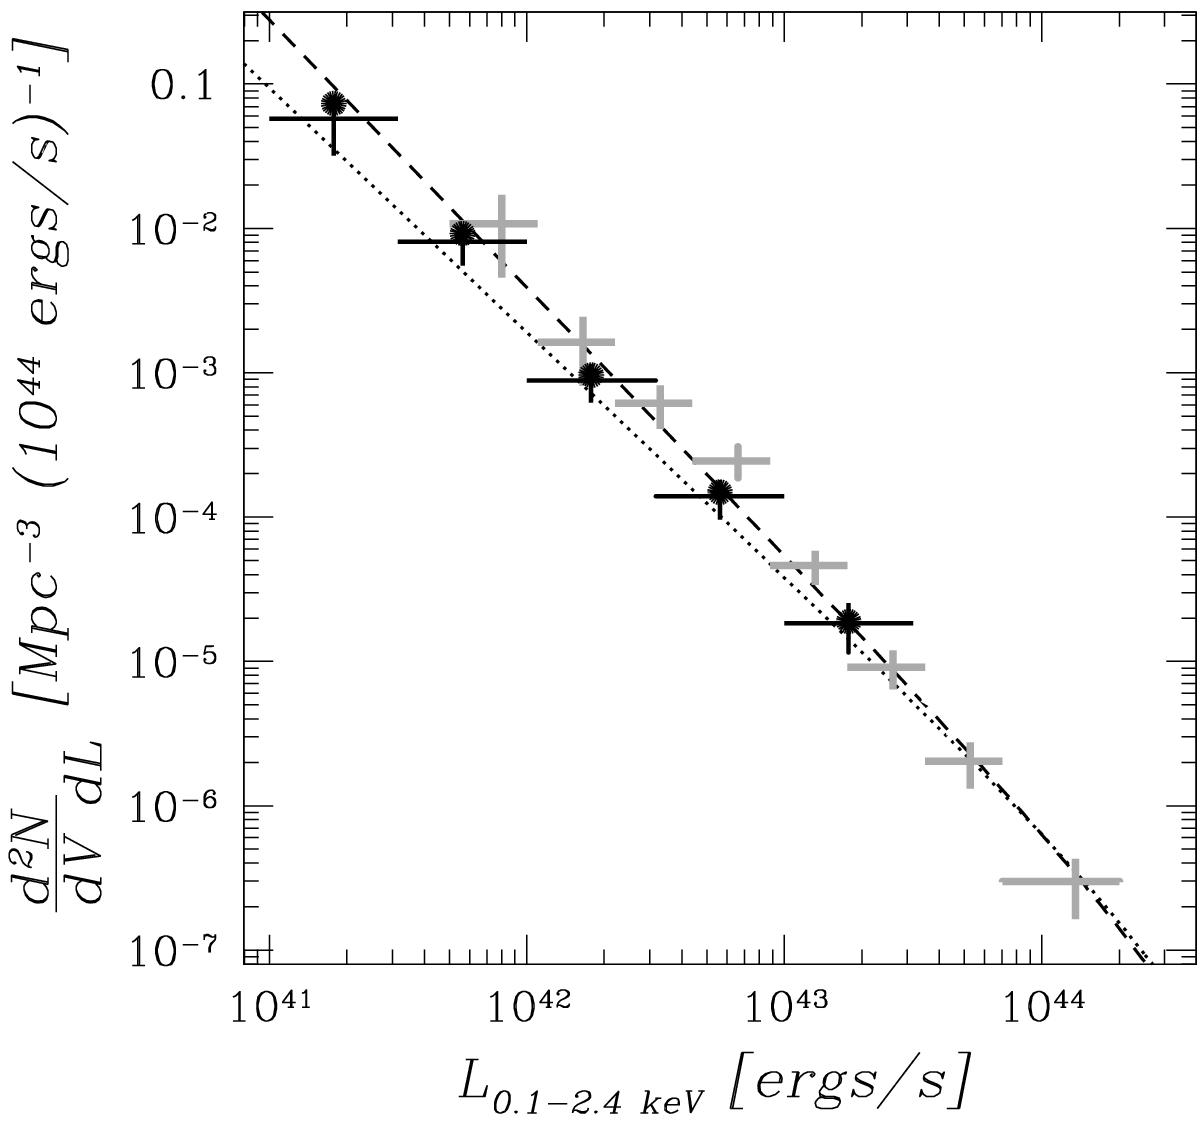
X-ray luminosity function of ECDF-S groups. Black dots show the measurement using the full field, while black crosses show the measurements excluding the central region where there is a low spatial density of groups. Gray crosses show the results from the COSMOS field. Dashed and dotted curves show the local XLF in the Northern and Southern Hemisphere, revealing an effect of sample variance, caused by small volumes probed by RASS at low group luminosities.
Current usage metrics show cumulative count of Article Views (full-text article views including HTML views, PDF and ePub downloads, according to the available data) and Abstracts Views on Vision4Press platform.
Data correspond to usage on the plateform after 2015. The current usage metrics is available 48-96 hours after online publication and is updated daily on week days.
Initial download of the metrics may take a while.