Fig. 14
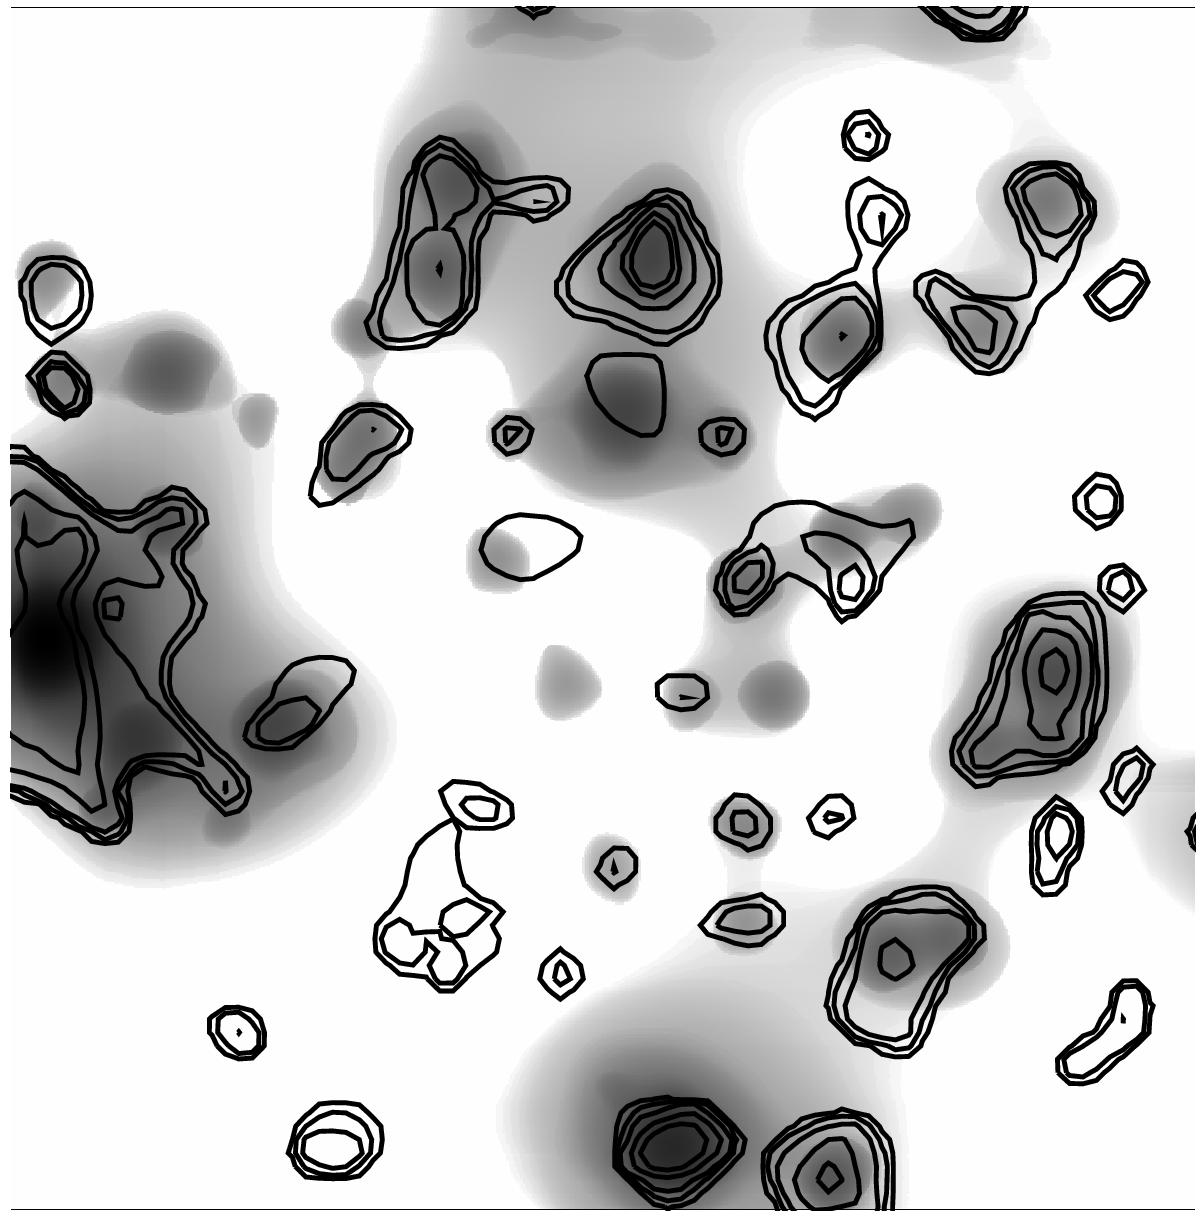
Wavelet reconstruction of the simulated image of extended emission in the ECDF-S area on scales of 0.5−2 arcmin. The contours of the observed X-ray emission on matched spatial scales are overlaid in black. Contours not aligned with simulated X-ray emission correspond to unidentified sources. The contours do not show the largest scales of the emission, but similarity between the model image and the S/N image in Fig. 6 is clear.
Current usage metrics show cumulative count of Article Views (full-text article views including HTML views, PDF and ePub downloads, according to the available data) and Abstracts Views on Vision4Press platform.
Data correspond to usage on the plateform after 2015. The current usage metrics is available 48-96 hours after online publication and is updated daily on week days.
Initial download of the metrics may take a while.