Fig. 11
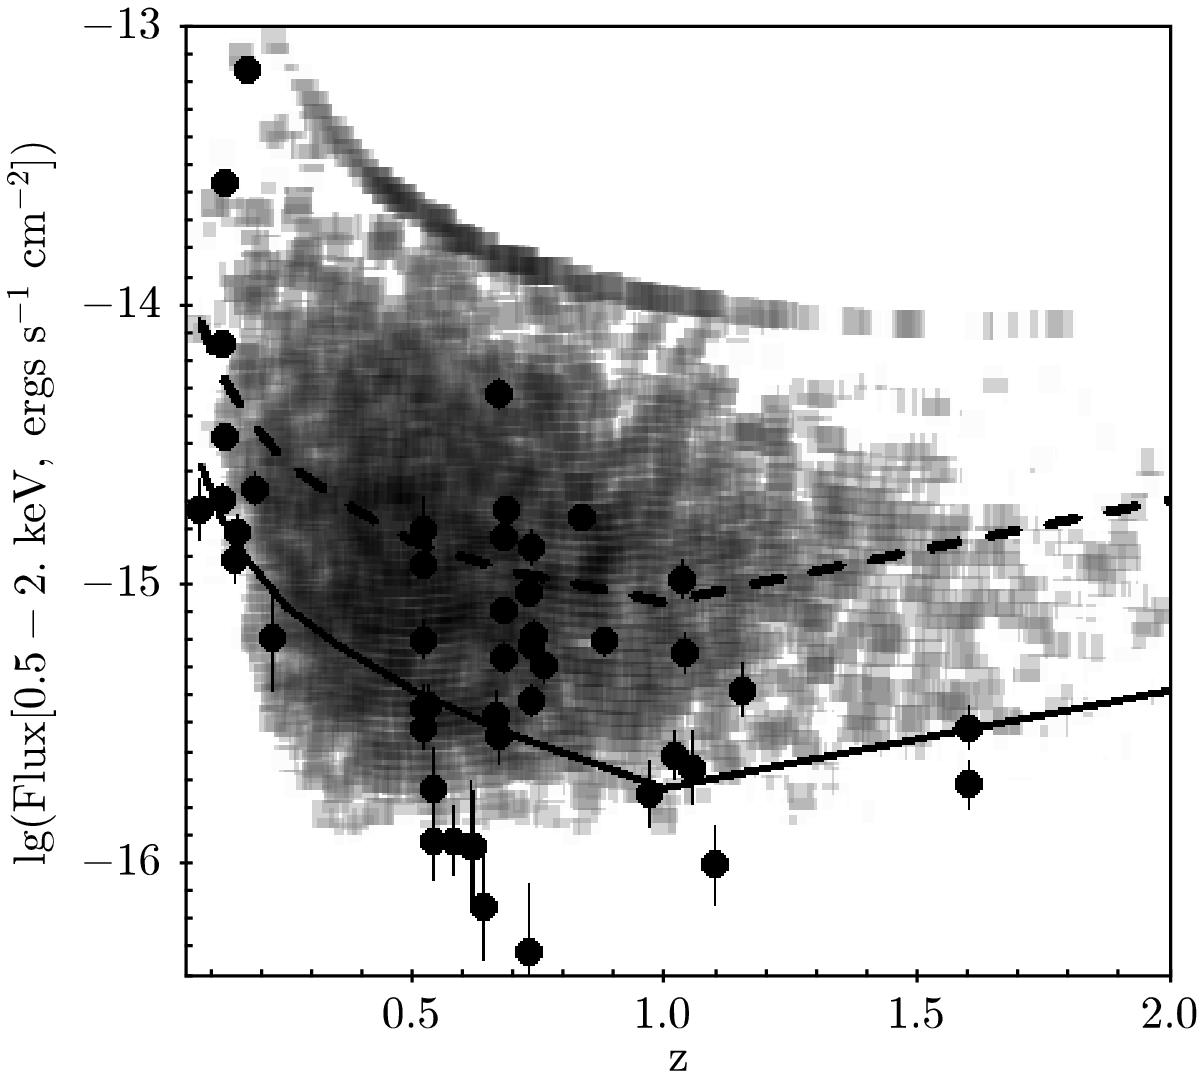
Flux-redshift plane of the ECDF-S sample (filled circles with error bars). The grey shades show the distribution of the parameters of the detected groups in simulations, with Planck cosmological parameters (Planck Collaboration XXVI 2014) and the scaling relations of Leauthaud et al. (2010) used. Due to the limited spatial scales used, at low redshifts the effective sensitivity towards the total flux is lower. The upper boundary on the flux distribution shows the combination of the ECDF-S survey volume and cosmology. The dashed and solid lines show the location of 90% and 50% detection completeness level.
Current usage metrics show cumulative count of Article Views (full-text article views including HTML views, PDF and ePub downloads, according to the available data) and Abstracts Views on Vision4Press platform.
Data correspond to usage on the plateform after 2015. The current usage metrics is available 48-96 hours after online publication and is updated daily on week days.
Initial download of the metrics may take a while.