Fig. 10
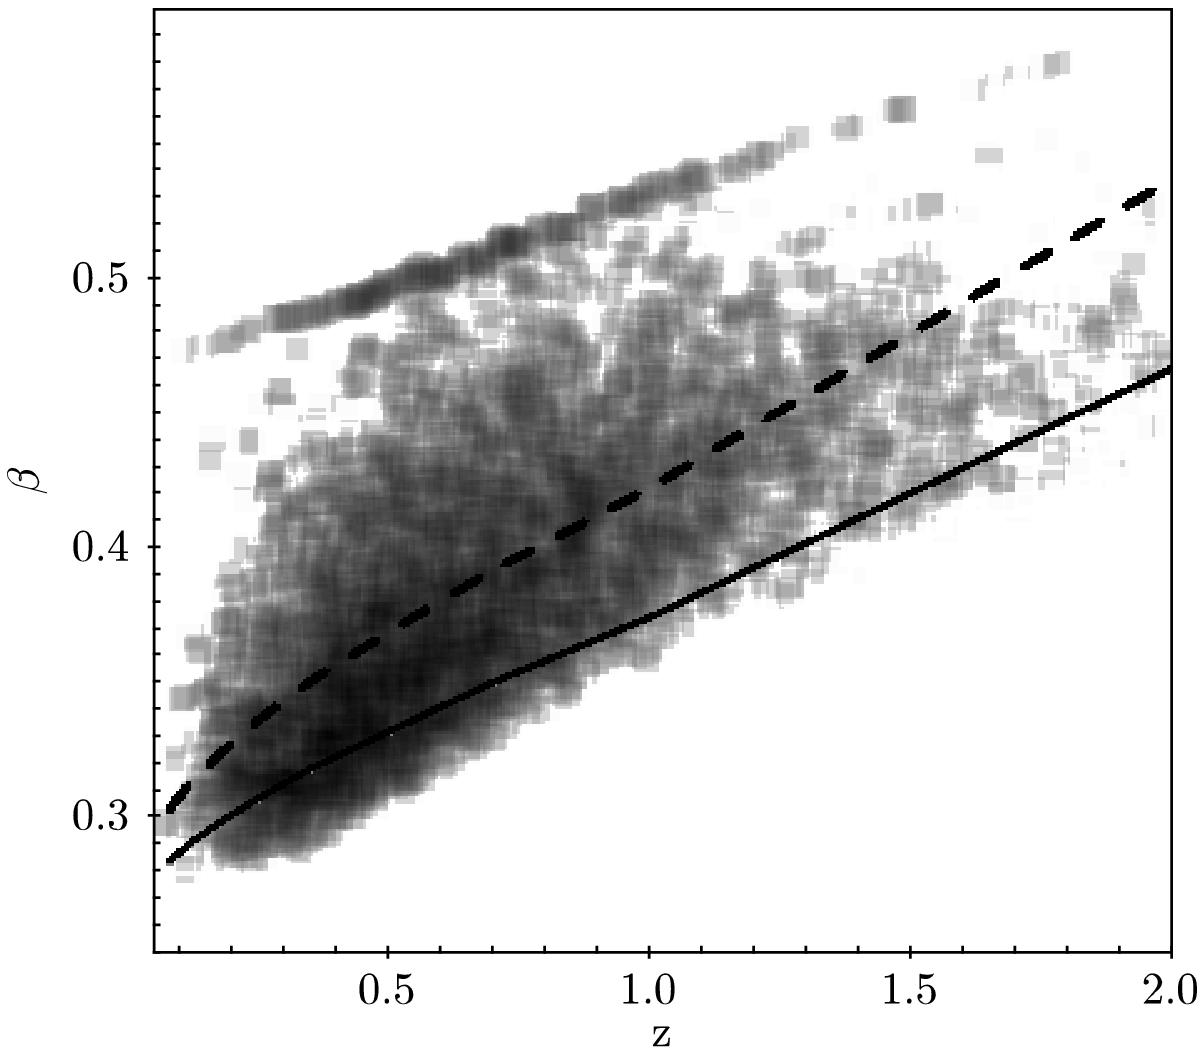
Distribution of the beta parameter of the detected simulated extended sources. The shades show the detected sources in the “Confusion” run, with shades of grey illustrating the overlap of sources. The dashed and solid lines show the location of 90% and 50% detection completeness level. The value of beta is uniquely determined by the mass and redshift of the halo, using the tabulations of Finoguenov et al. (2007).
Current usage metrics show cumulative count of Article Views (full-text article views including HTML views, PDF and ePub downloads, according to the available data) and Abstracts Views on Vision4Press platform.
Data correspond to usage on the plateform after 2015. The current usage metrics is available 48-96 hours after online publication and is updated daily on week days.
Initial download of the metrics may take a while.