Fig. 2
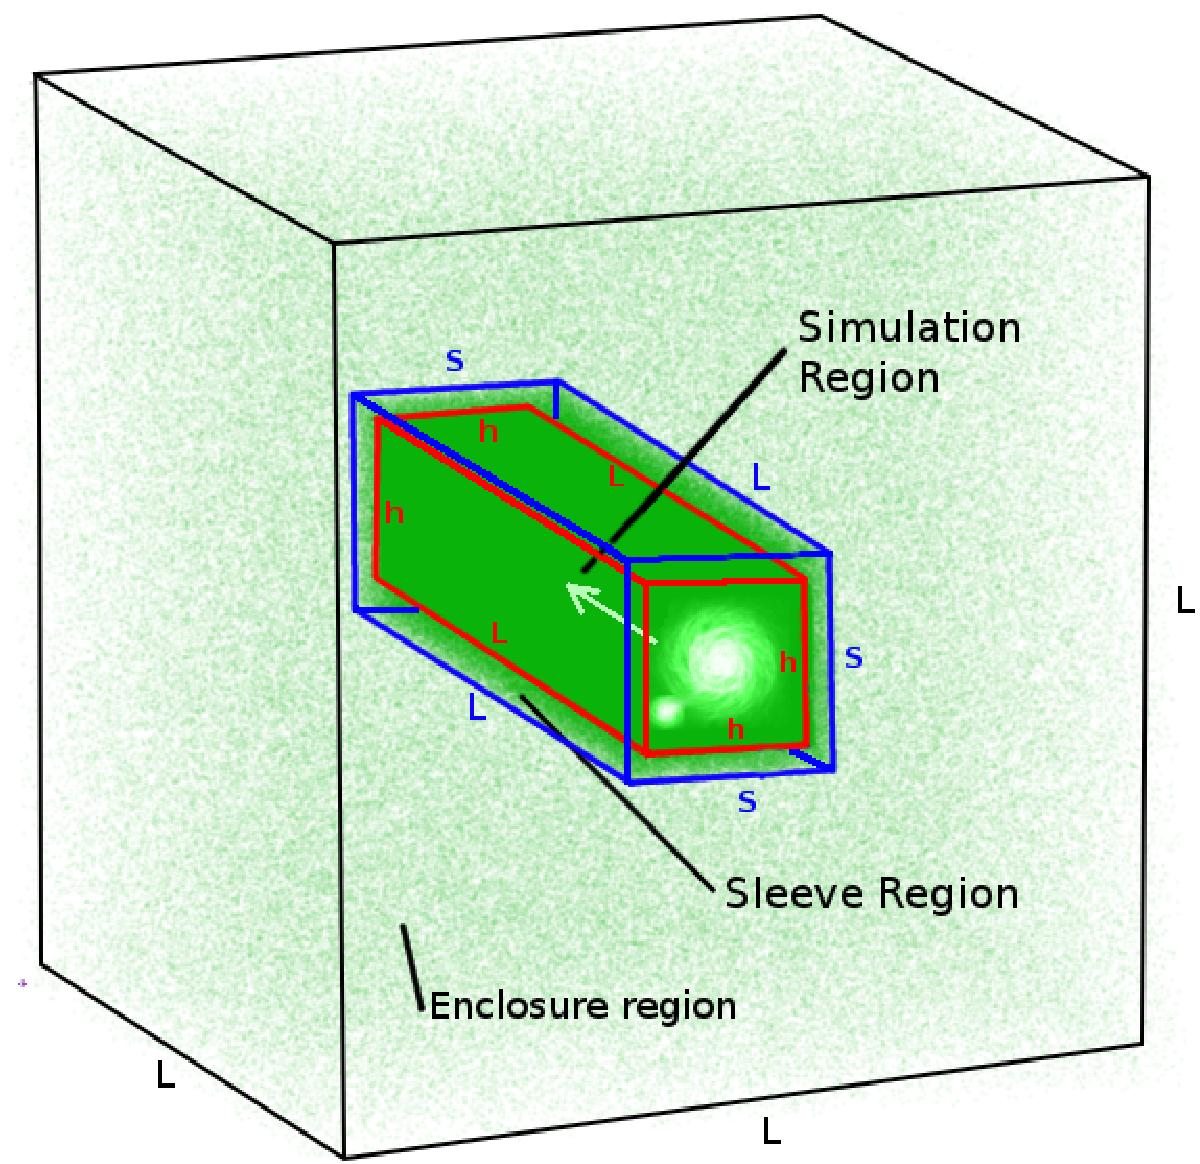
Three-layered ICM setup. Shown is the region of high resolution (inner border, h × h × L) in which the simulated merger takes place, the encompassing sleeve region of lower resolution (border S × S × L) and the rest of the simulation domain (outermost cube of edge length L). The particle’s number density is indicated in shades of green. Galaxies move along the arrow inside the region of high-mass resolution.
Current usage metrics show cumulative count of Article Views (full-text article views including HTML views, PDF and ePub downloads, according to the available data) and Abstracts Views on Vision4Press platform.
Data correspond to usage on the plateform after 2015. The current usage metrics is available 48-96 hours after online publication and is updated daily on week days.
Initial download of the metrics may take a while.