Free Access
Fig. 13
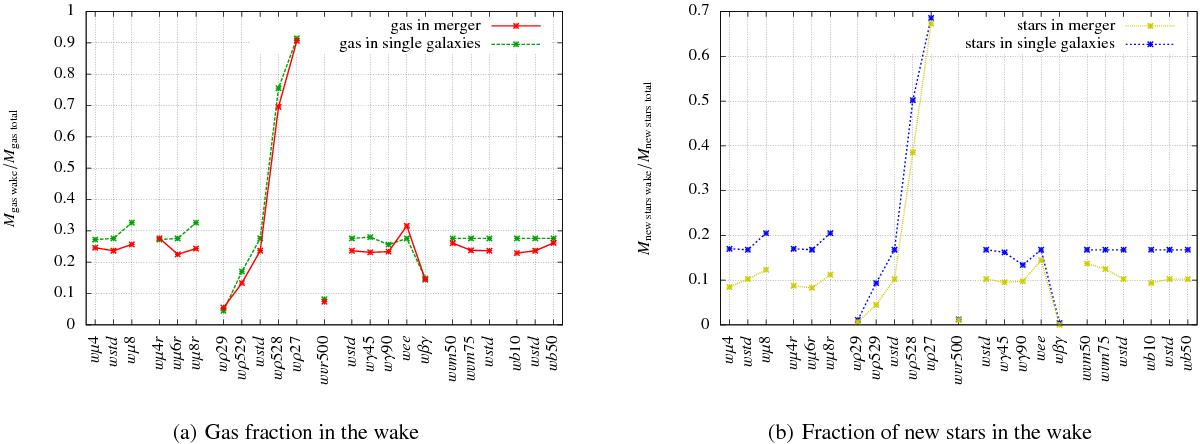
Gas and new star mass in the wake relative to the respective components’ total mass (t = 1 Gyr). Shown are the values for both the merger simulations in ICM and the added single galaxies in ICM that make up the respective merger.
This figure is made of several images, please see below:
Current usage metrics show cumulative count of Article Views (full-text article views including HTML views, PDF and ePub downloads, according to the available data) and Abstracts Views on Vision4Press platform.
Data correspond to usage on the plateform after 2015. The current usage metrics is available 48-96 hours after online publication and is updated daily on week days.
Initial download of the metrics may take a while.