Free Access
Fig. 4
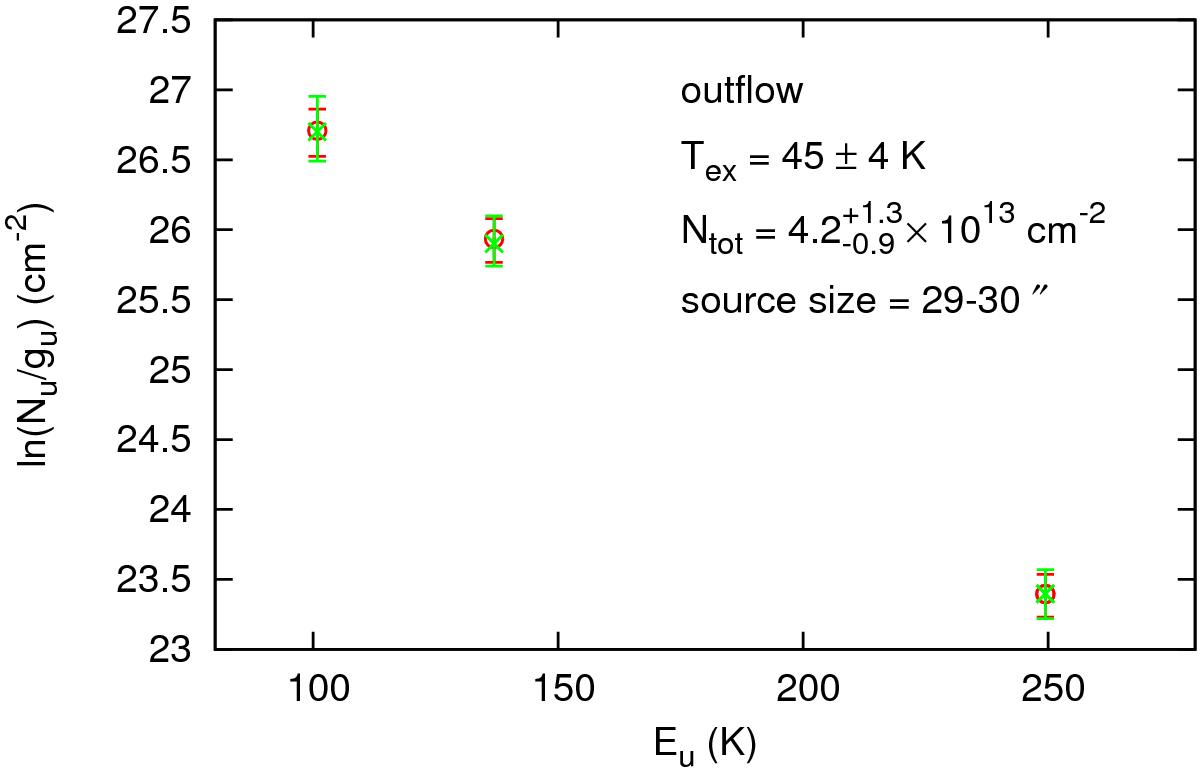
Rotation diagram for the broad emission components seen in p-H2O 202−111, p-H2O 211−202, and o-H2O 312−303 (outflow). Red open circles are the data observed with Herschel/HIFI. The green crosses represent the best-fit model from the population diagram analysis.
Current usage metrics show cumulative count of Article Views (full-text article views including HTML views, PDF and ePub downloads, according to the available data) and Abstracts Views on Vision4Press platform.
Data correspond to usage on the plateform after 2015. The current usage metrics is available 48-96 hours after online publication and is updated daily on week days.
Initial download of the metrics may take a while.