Free Access
Fig. 1
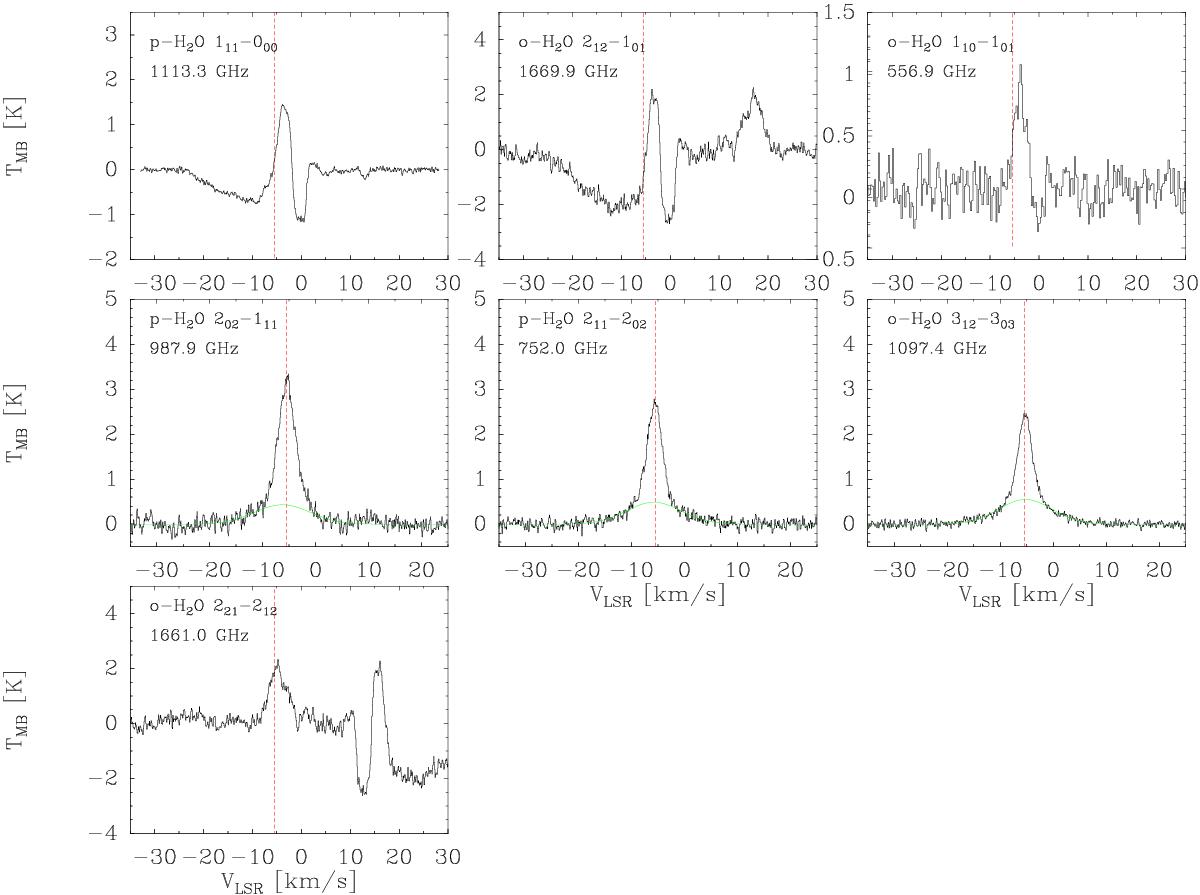
Spectra of H![]() O lines toward the high-mass star-forming region AFGL 2591. Dashed red lines are drawn at the source velocity VLSR = −5.5 km s-1. Green lines present the outflow components. We note that the H2O 212−101 and 221−212 lines occur in opposite sidebands of the same spectrum, causing the features near 20 km s-1.
O lines toward the high-mass star-forming region AFGL 2591. Dashed red lines are drawn at the source velocity VLSR = −5.5 km s-1. Green lines present the outflow components. We note that the H2O 212−101 and 221−212 lines occur in opposite sidebands of the same spectrum, causing the features near 20 km s-1.
Current usage metrics show cumulative count of Article Views (full-text article views including HTML views, PDF and ePub downloads, according to the available data) and Abstracts Views on Vision4Press platform.
Data correspond to usage on the plateform after 2015. The current usage metrics is available 48-96 hours after online publication and is updated daily on week days.
Initial download of the metrics may take a while.