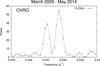
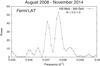
Fig. 2
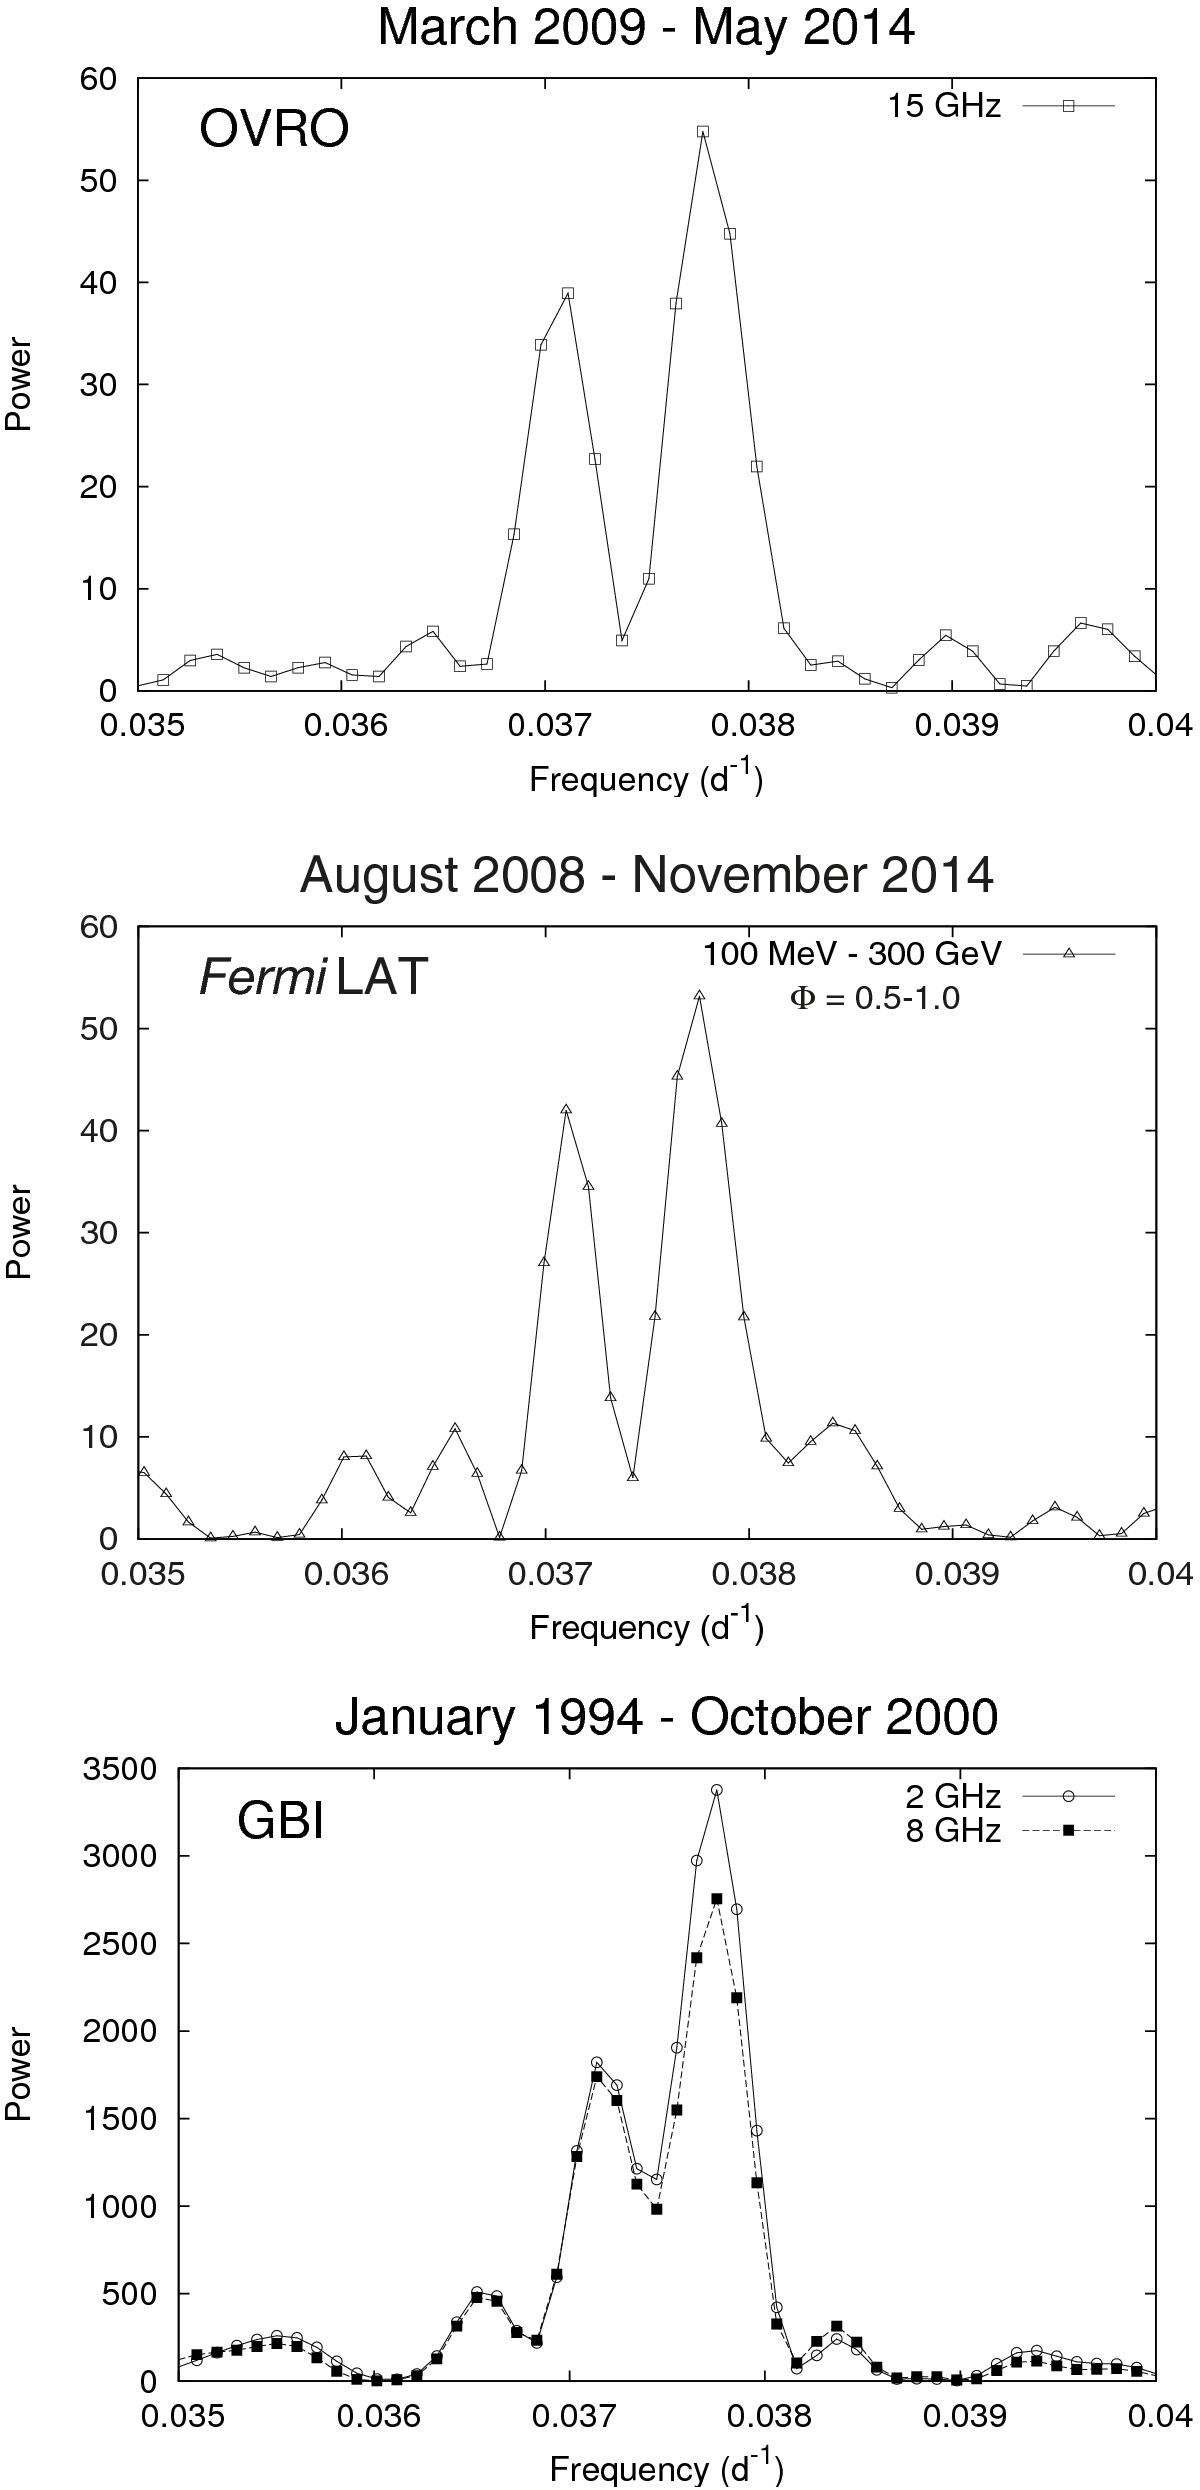
Lomb-Scargle periodograms of three independent long-term monitorings of LS I +61°303. Top: OVRO at 15 GHz. Centre: Fermi-LAT in the energy range 100 MeV to 300 GeV using only data from the orbital phase interval Φ = 0.5−1.0 (see Jaron & Massi, 2014). Bottom: GBI at 2 GHz (empty circles) and 8 GHz (filled squares) (see Massi & Jaron, 2013). In all periodograms there are two periodicities with a false-alarm probability of between 0.00 and 0.01 (see Sect. 2). The ratio (R) between the intensity of the two spetral features at P1 and P2 is different in the different periodograms and is R = 1.9 at 2 GHz and R = 1.5 at 8 GHz for GBI data, R = 1.4 at 15 GHz and R = 1.3 for GeV data.
Current usage metrics show cumulative count of Article Views (full-text article views including HTML views, PDF and ePub downloads, according to the available data) and Abstracts Views on Vision4Press platform.
Data correspond to usage on the plateform after 2015. The current usage metrics is available 48-96 hours after online publication and is updated daily on week days.
Initial download of the metrics may take a while.