Fig. 1
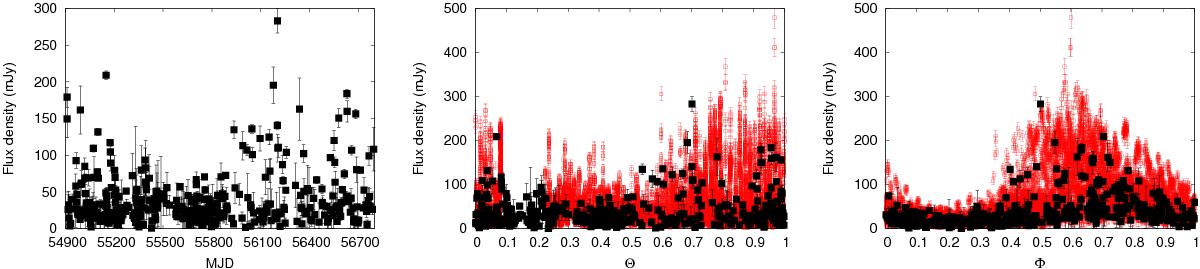
Left: OVRO data vs. MJD. Centre: OVRO (filled squares, black) data and GBI 8 GHz data (empty squares, red) vs. Θ; Θ is the fractional part of (t − t0) / 1667 with t0 = JD 2 443 366.775 (Gregory, 2002). Right: OVRO (black) data and GBI 8 GHz data (red) vs. Φ, where Φ is the orbital phase, i.e., the fractional part of (t − t0) /P1, with P1 = 26.496 days (Gregory, 2002). The largest radio outbursts occur around Φ = 0.6. At Φ = 0.23, i.e., at periastron, only a low level of emission is present.
Current usage metrics show cumulative count of Article Views (full-text article views including HTML views, PDF and ePub downloads, according to the available data) and Abstracts Views on Vision4Press platform.
Data correspond to usage on the plateform after 2015. The current usage metrics is available 48-96 hours after online publication and is updated daily on week days.
Initial download of the metrics may take a while.