Free Access
Fig. 3
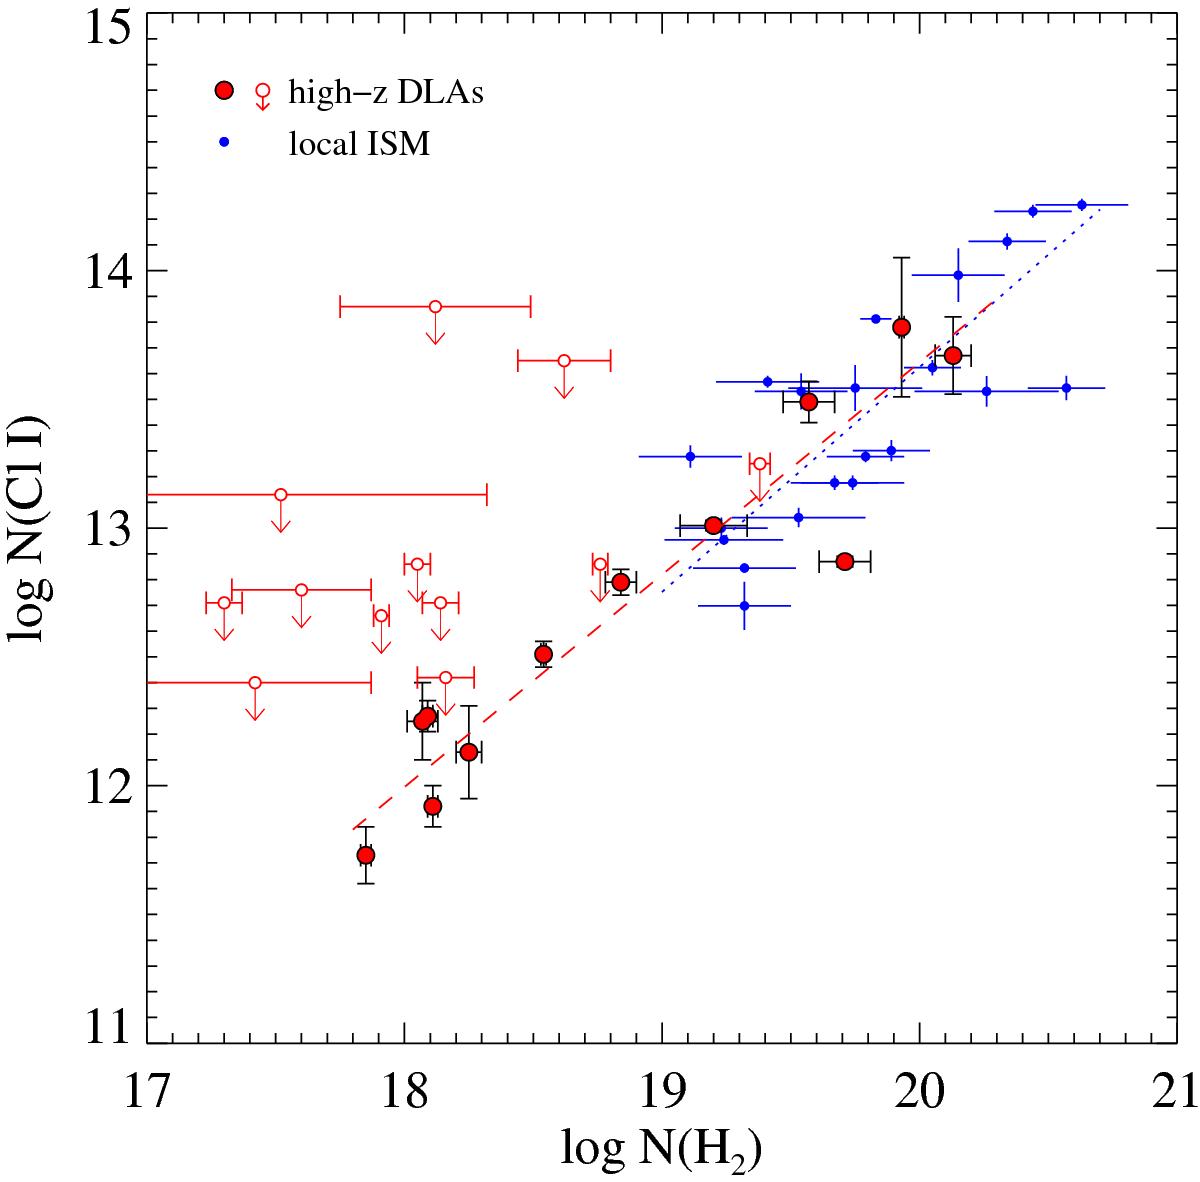
Column densities of Cl i versus that of H2. The red and blue points indicate the measurements at high redshift (this work) and in our Galaxy (Moomey et al., 2012), respectively. The straight dashed and dotted lines show the respective least-squares bisector fits to the data.
Current usage metrics show cumulative count of Article Views (full-text article views including HTML views, PDF and ePub downloads, according to the available data) and Abstracts Views on Vision4Press platform.
Data correspond to usage on the plateform after 2015. The current usage metrics is available 48-96 hours after online publication and is updated daily on week days.
Initial download of the metrics may take a while.